Headline evidence · Immigration · United Kingdom · year to December 2025 (provisional)
Net migration has fallen by more than three-quarters from its peak, to 171,000. Small-boat arrivals are about one in 20 of the people arriving.
Net migration, people arriving minus people leaving, was 171,000 in the year to December 2025, down from a peak of 944,000 in the year to March 2023. About one in 20 people arriving came by small boat.
Proposed outcome: Assess different types of migration and their local effects. Improve asylum decisions and plan services accordingly. What could change →
- Geography
- United Kingdom
- Evidence period
- year to December 2025, provisional
- Evidence status
- Provisional
- Editorial review
- Reviewed 21 October 2026
The short version
Three key measures
How much has net migration changed in a year?
171,000net, provisional
More people arrived than left. That difference nearly halved in a year; arrivals themselves did not halve. The estimate is provisional.
Arrivals, departures and net change →United Kingdom · year to December 2025, provisional · Provisional
Definition, limits and source: How much has net migration changed in a year?
Down from a revised 331,000 in the year to December 2024, a 48% fall in net migration. ONS’s 95% range is 145,000 to 197,000. The two flows, separately: 813,000 arrivals (1,012,000 a year earlier) and 642,000 departures (680,000). Arrivals did not halve; net is the difference between them.
Provisional · ONS, Long-term international migration, provisional (dataset), Tables 1 and 2
Survey-based evidence
British Election Study 2024 Post-Election Random Probability SurveyFieldwork: 5 July to 11 December 2024Adults 18+ in Great Britain eligible to vote on 4 July 2024; face to face, then push-to-web. Estimates have sampling uncertainty (about 1.4 points).How much of an issue is immigration for voters?
13%named it the top issue
About one voter in eight named immigration as the most important issue facing the country in 2024, third after living costs and the NHS. In a March 2026 poll it came first.
How big an issue is it? →Great Britain, adults 18+ · July to December 2024
Definition, limits and source: How much of an issue is immigration for voters?
13% of adults in Great Britain named immigration as the single most important issue facing the country, third after living costs and the NHS and level with the NHS within the margin of error. Fieldwork July to December 2024. In an Ipsos telephone poll in March 2026, 22% named it as the single most important issue, first. Different surveys, years and methods: not a trend.
Survey-based · British Election Study, 2024: Post-Election Random Probability Survey, question A01, most important issue
Why do people from outside the EU come?
47%to study
The share coming to study, including dependants, among arrivals from outside the European group counted here.
Work, study, family and humanitarian routes →United Kingdom · year to December 2025, provisional
Definition, limits and source: Why do people from outside the EU come?
294,000 of 627,000 non-EU+ arrivals came to study, with dependants. Work-related arrivals fell from 471,000 in 2023 to 146,000. Non-EU+ nationals are 77% of all arrivals.
Provisional · ONS, Long-term international migration, provisional (dataset), Table 4b
Who feels this most?
Migration’s effects land unevenly — by place, by sector and by service. Relative to its size, international migration adds most to London’s population (below); work visas were concentrated in health and social care, which recruited heavily from abroad after 2022. The same places and services that gain workers also absorb the extra demand. What migration adds, and costs, in public services and the economy.
The evidence
Selecting immigration as an important issue does not show whether someone wants more or less migration, or which policy they support.
How big an issue is it?
Immigration is one of the top issues people name, but how far up depends on the survey. After the 2024 election it was third, behind living costs and level with the NHS. In an Ipsos poll in March 2026 it was first. Both are real; they measure different things at different times. See every issue side by side.
Survey-based evidence
British Election Study 2024Fieldwork: 5 July to 11 December 2024Adults 18+ in Great Britain eligible to vote on 4 July 2024; face to face, then push-to-web. Weighted; estimates have sampling uncertainty.
British Election Study, July to December 2024
Single most important issue, 3,089 adults in Great Britain (random sample; open answer). Immigration was third: level with the NHS within the margin of error.
- Living costs23%
- NHS and health14%
- Immigration13%
- Economy, jobs and pay13%
- Politics and trust in government6%
Ipsos Issues Index, March 2026
Single most important issue, 1,005 adults in Great Britain by telephone, 4 to 10 March 2026. Immigration was first.
- Immigration22%
- Economy15%
- Defence and foreign affairs12%
- Inflation and prices10%
- NHS4%
The two are different surveys, in different years, with different methods and issue lists, so they are not a trend. In Ipsos’s monthly series the share who mention immigration among their main issues ran from 37% to 43% between February and August 2026; YouGov’s September 2026 tracker, which lets people pick several issues, has it at 41%. Salience measures what people name, not how large the problem is.
Net migration since the peak
Net migration peaked at 944,000 in the year to March 2023 and was 171,000 in the year to December 2025, a fall of 82%. Most of the rise and fall came from people from outside Europe arriving to study and work, with a fall in work and care visas since 2023. The latest year is provisional and will be revised.
Legal and irregular: two different things
Most people who come to Britain do so on a visa: to study, work, join family or on a humanitarian route. A much smaller number arrive by routes the Home Office calls illegal, nearly all of them in small boats. Claiming asylum is lawful once a person is in the UK, and about two in five asylum claims come from people who already held a visa or leave. We show the two in the same units so their size is clear, without adding them together.
Legal routes: visas granted, year ending June 2026
Grants, not arrivals: some people do not travel, and visas are not the same as people staying.
- Study383kSponsored study visas, down 11% on the year and 41% on the peak
- Work235kIncluding dependants; down 18% on the year and 62% on the peak. Of these, 120,000 were ‘Worker’ visas (Skilled Worker, Health and Care Worker and other worker routes), down 76% on the peak in the year to December 2023
- Humanitarian routes125kGrants of leave on safe and legal routes, down 12%
- Family58kDown 19%
Irregular routes: arrivals detected, year ending June 2026
The same axis as the legal routes, so the scale is comparable. Detections, not a count of everyone entering without permission.
- All illegal-entry routes38,086
- of which small boats33,374
Migrants detected crossing the English Channel in small boats, by calendar year (Home Office daily time series, summed). Weather-driven; detections, not unique people.
- 2018299
- 20191,843
- 20208,462
- 202128,526
- 202245,755
- 202329,437
- 202436,816
- 202541,472
- 2026 (to 2026-10-15)20,935
Asylum claims, including dependants, were 33,189 in January to June 2026 (85,891 in the year to June 2026). About 41% of claims in the year to June 2026 were made by people who had held a visa or leave before, and 40% by people who arrived by small boat.
There is no official estimate of how many people are in the UK without permission. The latest published estimates are for 2017 (Pew revised 700,000 to 900,000; Greater London Authority central 674,000), so we show no figure.
Do people arriving by small boat get free homes and benefits?
Partly, and not in the way it is often described. People seeking asylum cannot claim Universal Credit or Housing Benefit while their claim is decided. If they would otherwise be destitute, the Home Office pays for their accommodation and a weekly allowance of £49.18 a week per person, or £9.95 if meals are provided. That is public money, and it is large: the Home Office spent £4.18bn on asylum support, resettlement and accommodation in 2025-26. Access to benefits and to work comes only after a claim succeeds.
| Question | Short answer | The detail |
|---|---|---|
| Can someone who has just arrived by small boat claim Universal Credit or Housing Benefit? | No | No. Asylum seekers have no recourse to public funds in the ordinary sense and cannot claim Universal Credit or Housing Benefit while their claim is pending. |
| Do they get a free home? | Partly | If they would otherwise be destitute, the Home Office provides accommodation, in hotels, hostels or shared housing, and pays for it. They cannot choose where. This is state-funded, which is the part of the claim that is true. |
| Do they get cash? | Partly | A weekly allowance of £49.18 per person, or £9.95 where meals are provided. Support ends if the claim is refused and the appeal rights are exhausted, with limited exceptions. |
| Can they work? | No | Not while the claim is pending, except after 12 months in jobs on the Immigration Salary List. The guidance was updated on 19 October 2026. |
| What changes if they are granted refugee status? | Later | They can work and claim benefits and apply for social housing on the same basis as others, under local allocation rules. For claims made from 2 March 2026, initial protection leave is 30 months. Whether the new 30-month status carries the same benefit access has not been checked. |
The Home Office line for asylum support, resettlement and accommodation was £4.18bn in 2025-26, down from £4.51bn in 2024-25 on the same line. It includes resettlement, so it is not the cost of hotels alone. The 2024-25 accounts also gave a narrower ‘asylum support spend’ of £4.0bn (down from £4.7bn), of which £2.1bn was hotels, about £5.77m a day; the 2025-26 accounts give no figure on that narrower basis, so the two measures are not compared here. A 2025-26 hotel cost in pounds was not found. 16,021 people on asylum support were in hotels at the end of June 2026, down from 56,018 at the September 2023 peak. Read on 21 October 2026 at GOV.UK; the rules change, so check the page.
What immigration costs and what it adds
The estimates depend on who comes, for how long and what is assumed about public services, so they come with large ranges. Skilled workers add a great deal to the public finances over their lifetimes; people on the lowest-paid routes and their dependants may cost more than they pay in. Asylum costs are a different kind of cost, paid in the short term. The effect on average wages is small, slightly negative for the lowest paid. We have not costed the options to change policy, so none is shown. What migration adds, and costs, in more detail.
Model
OBR scenario and forecast, as set out by the IFS (Green Budget, September 2026)
In the OBR's scenarios, 200,000 more net migrants a year lowers borrowing by about £20bn a year, or about £13bn if spending on public services rises to keep quality unchanged. The IFS cautions this is unlikely to be the actual effect. The OBR assumes net migration of 235,000 a year for 2026 to 2030.
Estimate
Migration Advisory Committee, fiscal impact of immigration (December 2025), as quoted by the IFS
The Skilled Worker 2022/23 entry cohort is worth about £47bn over their lifetimes, with 72% of the gain from the top 30% of earners. Per person, the present value is about £689,000 for Skilled Worker, £54,000 for Health and Care Worker and minus £67,000 for dependants of Health and Care workers. These cover one route only.
Workforce data
Skills for Care
About 150,000 adult social care posts were filled by someone on a Health and Care Worker visa at March 2026. The British share of care workers fell from 83% to 65% between 2021/22 and 2025/26.
Review of studies
MAC 2018 and Migration Observatory (February 2026)
Little effect on average wages, slightly negative for the lowest paid. Evidence on housing is old: prices are higher, more so where planning is restrictive.
What people think, and what is measured
Survey-based evidence
British Election Study 2024Fieldwork: 5 July to 11 December 2024Adults 18+ in Great Britain eligible to vote on 4 July 2024; face to face, then push-to-web. Weighted; estimates have sampling uncertainty.
“Too many immigrants have been let into this country”: yes, by age
Share saying yes among those with a view (2,843), British Election Study 2024.
- Aged 18-3451%
- Aged 35-5459%
- Aged 55+75%
- All adults64%
Is immigration good or bad for the economy?
2,990 adults, British Election Study 2024.
- Good for the economy (5 to 7 on a 7-point scale)51%
- Neither (4)20%
- Bad for the economy (1 to 3)30%
Older voters are far more likely to say there are too many, and young voters name immigration as the top issue much less often (18-34: 6%, 35-54: 10%, 55+: 20%). The survey has no questions that separate legal from irregular immigration; the published contrast is on the survey sources below.
People’s sense of the numbers is far from the figures. In a British Future survey in May 2026 the public guessed that asylum seekers were about 33% of migrants; the actual share is about 9%. 49% thought net migration had risen over the past year, in a year when it fell. A Migration Observatory briefing found 71% of people negative towards small-boat asylum seekers against 22% negative towards those following the legal process: two different questions about two different groups, not a trend.
Read on the organisation's news page only; the tracker PDF could not be opened, so the fieldwork provider's wording and sample were not checked. Read by fetch only; the underlying YouGov and Ipsos tables were not opened. Two different questions about two different groups.
Annual data: Net migration across published methods
The archive uses the older survey-based LTIM method, rounded to thousands. Its 2001–2011 net balances were revised after Census 2011 without revising all its inflows and outflows. The current administrative-data series is shown separately from 2012, using December year ends only. The overlapping columns are different estimates, not extra migrants. Do not join them into one trend or calculate a cross-method change. Current estimates remain revisable; 2026 has no full-calendar-year observation. A dash means no comparable observation is supplied; it is not zero. United Kingdom, all citizenships/nationalities; long-term moves of at least 12 months.
1996–2026; people per calendar year. No change is calculated across definition or assessment breaks.
| Year | Archive | Current |
|---|---|---|
| 1996 | 55,000 | — |
| 1997 | 48,000 | — |
| 1998 | 140,000 | — |
| 1999 | 163,000 | — |
| 2000 | 158,000 | — |
| 2001 | 179,000 | — |
| 2002 | 172,000 | — |
| 2003 | 185,000 | — |
| 2004 | 268,000 | — |
| 2005 | 267,000 | — |
| 2006 | 265,000 | — |
| 2007 | 273,000 | — |
| 2008 | 229,000 | — |
| 2009 | 229,000 | — |
| 2010 | 256,000 | — |
| 2011 | 205,000 | — |
| 2012 | 177,000 | 195,000 |
| 2013 | 209,000 | 244,000 |
| 2014 | 313,000 | 284,000 |
| 2015 | 332,000 | 303,000 |
| 2016 | 249,000 | 249,000 |
| 2017 | 285,000 | 208,000 |
| 2018 | 260,000 | 276,000 |
| 2019 | 313,000 | 184,000 |
| 2020 | — | 93,000 |
| 2021 | — | 467,000 |
| 2022 | — | 891,000 |
| 2023 | — | 848,000 |
| 2024 | — | 331,000 |
| 2025 | — | 171,000 |
| 2026 | No comparable observations supplied | |
Historical source: ONS Table 2.00, published November 2020. Current source: ONS provisional migration tables.
Arrivals, departures and net change
How do arrivals and departures add up to net migration?
813,000 arrivals minus 642,000 departures equals 171,000 net
Arrivals fell while departures remained high. That is why the difference nearly halved; arrivals themselves did not halve. These early estimates can be revised.
United Kingdom · year to December 2025 (provisional) · Official statistics in development; the latest year is provisional
Show the workings — 813,000 arrivals minus 642,000 departures equals 171,000 net
Long-term immigration, emigration and net migration (people moving for 12 months or more), all nationalities, United Kingdom, year to December 2025.
Net migration is the gap between two large flows, so modest changes in either move it a lot. Arrivals fell by 199,000 on the year while departures stayed high, which is why the net figure nearly halved. ONS puts the net figure between 145,000 and 197,000 (95% uncertainty interval), below the previous year’s published interval. These simulation intervals do not capture all sources of error and are not survey confidence intervals. First estimates move: the year to December 2024 was first put at 431,000, now 331,000.
- Geography:
- United Kingdom — Long-term international migrants, all nationalities
- Measure:
- People
- Period:
- year to December 2025 (provisional)
- Status:
- Official statistics in development; the latest year is provisional
- Calculation:
- As published by ONS (Table 1). All three are ONS estimates rounded to the nearest 1,000; departures are published, not derived. Net is immigration minus emigration.
- Compare with:
- year to December 2024: 331,000 net (revised), the amber mark
- Not included / breaks:
- Excludes short visits and people moving for under a year. Asylum seekers are included once they have stayed (or are expected to stay) a year; small-boat arrival counts are a different, Home Office measure and are not a component of this chart.
Source: ONS, Long-term international migration, provisional (dataset), Tables 1 and 2 (released 21 May 2026).
View the data as a table
| Flow | year to December 2025 | year to December 2024 (revised) |
|---|---|---|
| Immigration (arrivals) | 813,000 | 1,012,000 |
| Emigration (departures) | 642,000 | 680,000 |
| Net migration | 171,000 | 331,000 |
| Net migration, 95% range | 145,000–197,000 | 309,000–348,000 |
When did net migration peak?
The peak was 944,000 in the year to March 2023; the highest calendar year was 2022, at 891,000
1996–2026 · recorded figures. Shading marks years without figures: this series starts in 2012.
The highest rolling 12-month total and the highest calendar-year total fall in different years. Both show a large rise followed by a fall; the latest estimate is below the pre-pandemic average shown here.
United Kingdom · year to June 2012 to year to December 2025 · Official statistics in development; years from early 2025 are provisional
Show the workings — The peak was 944,000 in the year to March 2023; the highest calendar year was 2022, at 891,000
Long-term net migration, all nationalities, United Kingdom, rolling 12-month periods ending each quarter from June 2012.
Two "peaks" are quoted and both are right: 944,000 is the highest 12-month total (the year to March 2023, ONS’s headline peak), while 891,000 is the highest calendar year (2022). Calendar 2023 was lower, at 848,000. The surge came from non-EU+ students, health and care workers, their dependants and the Ukraine and Hong Kong schemes; the latest figure is close to the level of early 2021. Over the long run, the 2012–2019 average (calendar years, the pre-pandemic years of this series) was 243,000 a year; the latest year is below it.
- Geography:
- United Kingdom
- Measure:
- People per rolling year
- Period:
- year to June 2012 to year to December 2025
- Status:
- Official statistics in development; years from early 2025 are provisional
- Calculation:
- As published by ONS (Table 1). Each point is a 12-month total plotted at the end of its period; overlapping periods are not added together.
- Compare with:
- Calendar year 2022: 891,000
- Not included / breaks:
- The comparable series starts in 2012. Earlier survey-based estimates use a different method and are not joined on.
Source: ONS, Long-term international migration, provisional (dataset), Tables 1 and 2 (released 21 May 2026).
View the data as a table
| Year ending | Immigration | Emigration | Net migration | Status |
|---|---|---|---|---|
| Jun 2012 | 639,000 | 477,000 | 162,000 | revised |
| Sep 2012 | 630,000 | 473,000 | 157,000 | revised |
| Dec 2012 | 643,000 | 448,000 | 195,000 | revised |
| Mar 2013 | 649,000 | 446,000 | 204,000 | revised |
| Jun 2013 | 669,000 | 454,000 | 215,000 | revised |
| Sep 2013 | 720,000 | 461,000 | 259,000 | revised |
| Dec 2013 | 713,000 | 469,000 | 244,000 | revised |
| Mar 2014 | 731,000 | 475,000 | 256,000 | revised |
| Jun 2014 | 737,000 | 489,000 | 248,000 | revised |
| Sep 2014 | 761,000 | 497,000 | 264,000 | revised |
| Dec 2014 | 778,000 | 494,000 | 284,000 | revised |
| Mar 2015 | 780,000 | 484,000 | 296,000 | revised |
| Jun 2015 | 778,000 | 482,000 | 296,000 | revised |
| Sep 2015 | 774,000 | 481,000 | 293,000 | revised |
| Dec 2015 | 797,000 | 494,000 | 303,000 | revised |
| Mar 2016 | 803,000 | 506,000 | 298,000 | revised |
| Jun 2016 | 832,000 | 511,000 | 321,000 | revised |
| Sep 2016 | 804,000 | 514,000 | 290,000 | revised |
| Dec 2016 | 772,000 | 523,000 | 249,000 | revised |
| Mar 2017 | 759,000 | 519,000 | 240,000 | revised |
| Jun 2017 | 718,000 | 518,000 | 200,000 | revised |
| Sep 2017 | 754,000 | 549,000 | 205,000 | revised |
| Dec 2017 | 752,000 | 544,000 | 208,000 | revised |
| Mar 2018 | 736,000 | 543,000 | 193,000 | revised |
| Jun 2018 | 757,000 | 541,000 | 216,000 | revised |
| Sep 2018 | 766,000 | 539,000 | 226,000 | revised |
| Dec 2018 | 825,000 | 549,000 | 276,000 | revised |
| Mar 2019 | 849,000 | 575,000 | 274,000 | revised |
| Jun 2019 | 821,000 | 597,000 | 224,000 | revised |
| Sep 2019 | 793,000 | 591,000 | 202,000 | revised |
| Dec 2019 | 788,000 | 605,000 | 184,000 | revised |
| Mar 2020 | 815,000 | 645,000 | 170,000 | revised |
| Jun 2020 | 736,000 | 625,000 | 111,000 | revised |
| Sep 2020 | 606,000 | 571,000 | 35,000 | revised |
| Dec 2020 | 662,000 | 569,000 | 93,000 | revised |
| Mar 2021 | 629,000 | 496,000 | 132,000 | revised |
| Jun 2021 | 818,000 | 567,000 | 251,000 | revised |
| Sep 2021 | 937,000 | 552,000 | 384,000 | revised |
| Dec 2021 | 947,000 | 480,000 | 467,000 | revised |
| Mar 2022 | 1,069,000 | 495,000 | 575,000 | revised |
| Jun 2022 | 1,167,000 | 486,000 | 681,000 | revised |
| Sep 2022 | 1,317,000 | 496,000 | 822,000 | revised |
| Dec 2022 | 1,398,000 | 508,000 | 891,000 | revised |
| Mar 2023 | 1,469,000 | 525,000 | 944,000 | revised |
| Jun 2023 | 1,466,000 | 543,000 | 924,000 | revised |
| Sep 2023 | 1,461,000 | 570,000 | 891,000 | revised |
| Dec 2023 | 1,441,000 | 593,000 | 848,000 | revised |
| Mar 2024 | 1,359,000 | 625,000 | 734,000 | revised |
| Jun 2024 | 1,299,000 | 650,000 | 649,000 | revised |
| Sep 2024 | 1,159,000 | 662,000 | 497,000 | revised |
| Dec 2024 | 1,012,000 | 680,000 | 331,000 | revised |
| Mar 2025 | 945,000 | 685,000 | 260,000 | provisional |
| Jun 2025 | 888,000 | 669,000 | 219,000 | provisional |
| Sep 2025 | 862,000 | 661,000 | 202,000 | provisional |
| Dec 2025 | 813,000 | 642,000 | 171,000 | provisional |
Scroll the table sideways to see every column.
The total hides a change in who is moving. British nationals have left in larger numbers than they returned in every year of the series (−136k net in the latest year), and since 2022 more EU+ citizens have left than arrived (−42k). All of the net inflow is now non-EU+ nationals (350k). How the end of free movement changed the mix.
Work, study, family and humanitarian routes
ONS breaks arrivals down by reason only for non-EU+ nationals — 627,000 of the 813,000 people who arrived in the year to December 2025. Within that group, the routes moved at different speeds, which is why a single total says little about what any rule change did.
Why people arrive — and which population this breakdown covers
Study now leads non-EU+ arrivals; work-related arrivals have fallen by 69% since 2023
- Work (incl. dependants)
- Study (incl. dependants)
- Family
- Humanitarian schemes (Ukraine, Hong Kong BN(O), resettlement)
- Asylum
- Other
Study is now the largest reason for arrivals in this group. Work-related arrivals fell sharply after visa-rule changes. The figures exclude British and European-group arrivals.
United Kingdom · year to December 2019 to year to December 2025 · Official statistics in development; the latest year is provisional
Show the workings — Study now leads non-EU+ arrivals; work-related arrivals have fallen by 69% since 2023
Long-term immigration of non-EU+ nationals by main reason for coming, United Kingdom, years to December 2019–2025. Work and study include dependants.
The 2022–23 surge had several sources at once — students and their dependants, health and care workers, and the Ukraine and Hong Kong schemes — and they have unwound at different speeds. Work-related arrivals fell from 471,000 to 146,000 after the 2024 rule changes on care workers and dependants; study fell 36% from its peak. Asylum arrivals, at 88,000, are a minority of the total and have changed little. This is a subset: it says nothing about British or EU+ arrivals.
- Geography:
- United Kingdom — Non-EU+ nationals only — 77% of all long-term arrivals in 2025. British and EU+ arrivals are not broken down by reason.
- Measure:
- People arriving per year
- Period:
- year to December 2019 to year to December 2025
- Status:
- Official statistics in development; the latest year is provisional
- Calculation:
- As published by ONS (Table 4b); categories are ONS’s. Totals are the sum of the six categories and may differ from the published all-reasons figure by a few thousand because ONS rounds each cell.
- Compare with:
- Peak years: work 471,000 (2023), study 461,000 (2023), humanitarian 190,000 (2022)
- Not included / breaks:
- "Asylum" counts people who claimed asylum within a year of arriving, however they came; it is not a count of small-boat arrivals. "Humanitarian" covers the Ukraine and Hong Kong BN(O) schemes and refugee resettlement. Arrivals only: some of these people have since left.
Source: ONS, Long-term international migration, provisional (dataset), Table 4b (released 21 May 2026).
View the data as a table
| Year | Work | Study | Family | Humanitarian schemes | Asylum | Other | Total (sum) |
|---|---|---|---|---|---|---|---|
| 2019 | 99,000 | 120,000 | 78,000 | 6,000 | 42,000 | 23,000 | 368,000 |
| 2020 | 71,000 | 112,000 | 56,000 | 1,000 | 35,000 | 20,000 | 295,000 |
| 2021 | 145,000 | 259,000 | 68,000 | 57,000 | 55,000 | 26,000 | 610,000 |
| 2022 | 291,000 | 430,000 | 67,000 | 190,000 | 85,000 | 27,000 | 1,090,000 |
| 2023 | 471,000 | 461,000 | 89,000 | 75,000 | 75,000 | 16,000 | 1,187,000 |
| 2024 | 272,000 | 274,000 | 84,000 | 49,000 | 87,000 | 14,000 | 780,000 |
| 2025 (P) | 146,000 | 294,000 | 47,000 | 35,000 | 88,000 | 18,000 | 628,000 |
Scroll the table sideways to see every column.
Asylum and small boats: separate measures
Asylum is counted by the Home Office as claims, decisions and people supported, not as long-term migration. In the year to June 2026, 85,891 people claimed asylum and 115,872 received a first decision; 38% of decisions that were not withdrawals granted protection or other leave. The queue for a first decision fell to 40,168, from 160,919 at the end of 2022.
33,374 small-boat arrivals were detected in the same period. Nearly all claim asylum — but so do people who arrived with a visa: in 2025, 39,238 claims came from people who had held a visa or other leave, against 41,380 from small-boat arrivals. Decisions, accommodation and returns in detail.
Why it is happening
Our analysis
Visa choices affect who can move to Britain. For asylum, faster first decisions do not solve delays in appeals or the need for housing; these stages must work together.
Who is affected most
Who feels this most?
Local change, and what is not measured
Where does international migration add most to the population?
London gains 5.7 people per 1,000 residents from international migration; Wales, 0.5
Net international migration per 1,000 residents, mid-2024 to mid-2025England and Wales 3.4
- London5.7
- West Midlands4.9
- North West4.5
- North East4.4
- East Midlands3.1
- Yorkshire and The Humber2.7
- East of England2.7
- South East2.3
- South West1.9
- Wales0.5
International migration adds people unevenly across the country. Moves within Britain, births and deaths also affect local population and pressure on services; this chart cannot show the total change.
English regions and Wales · Mid-2024 to mid-2025 · Official statistics (ONS mid-year estimates); rates are a site calculation
Show the workings — London gains 5.7 people per 1,000 residents from international migration; Wales, 0.5
Net international migration (arrivals from abroad minus departures abroad) per 1,000 residents, English regions and Wales, mid-2024 to mid-2025.
International migration adds people unevenly: London’s rate is about 1.7 times the England and Wales figure. But it is only one part of local population change. London lost 131,961 people to the rest of the UK in the same year through net internal migration. That does not establish whether its total population rose or fell. Pressure on local homes and services depends on births, deaths and moves within the UK too, not on this figure alone.
- Geography:
- English regions and Wales — Usually resident population at mid-2024
- Measure:
- People per 1,000 residents
- Period:
- Mid-2024 to mid-2025
- Status:
- Official statistics (ONS mid-year estimates); rates are a site calculation
- Calculation:
- Site calculation: ONS net international migration for each area divided by its mid-2024 population, times 1,000.
- Compare with:
- England and Wales: 3.4 per 1,000 (211,691 people)
- Not included / breaks:
- Scotland and Northern Ireland publish separately and are not shown. Moves within the UK (internal migration) are a separate component, in the table. Local international flows are modelled and are less certain for small areas.
Source: ONS, Mid-year population estimates, England and Wales: mid-2025, Table MYE3 (components of change) (released 29 July 2026).
View the data as a table
| Area | International net | Per 1,000 | Internal (within UK) net | Per 1,000 |
|---|---|---|---|---|
| London | 51,839 | 5.7 | -131,961 | -14.4 |
| West Midlands | 30,051 | 4.9 | -9,330 | -1.5 |
| North West | 34,627 | 4.5 | 23,771 | 3.1 |
| North East | 12,201 | 4.4 | 7,439 | 2.7 |
| East Midlands | 15,550 | 3.1 | 13,623 | 2.7 |
| Yorkshire and The Humber | 15,172 | 2.7 | 3,265 | 0.6 |
| East of England | 17,595 | 2.7 | 25,154 | 3.8 |
| South East | 21,688 | 2.3 | 32,130 | 3.3 |
| South West | 11,311 | 1.9 | 25,093 | 4.3 |
| Wales | 1,657 | 0.5 | 4,876 | 1.5 |
| England and Wales | 211,691 | 3.4 | — | — |
Scroll the table sideways to see every column.
London shows why one flow is not the whole story: it gained 51,839 people from abroad but lost 131,961 to the rest of the UK. Population pressure on a town’s homes, schools and GP lists depends on all of these moves, plus births and deaths.
Three things are not measured well enough to show here:
- Arrivals by reason for each council area — ONS publishes reasons nationally only.
- The number of people living here without permission, including visa overstayers.
- How long recent arrivals stay: long-term migration counts intentions to stay a year, and many students leave after their course.
What could change
Proposals to consider. The bodies named below would need to agree to deliver them; responsibility is not a recorded commitment. Follow the links for costs and evidence.
Track asylum cases through appeals and safe move-on
Improve the steps after an asylum decision so delays do not simply move to appeals or homelessness services.
Who could deliver it: Home Office, tribunal administration, councils and accommodation commissioners..
Main trade-off and delivery needs
Rushed decisions, hidden appeals backlog and demand transferred to private rentals.
Audit an end-to-end cohort and test one bottleneck with tribunal/council participation. Specify the process change and unit costs; no banked hotel saving without alternative accommodation.
Cost: The extra cost is not yet known.
Costs, drawbacks and evidence →
See all options and what is still unknown →
Some problems have no assessed solution yet: see coverage and gaps.
Domain SWOT
Recorded
Show the findings
Strengths · 2 findings
The initial-decision queue has shrunk: 40,168 people were awaiting a first asylum decision at the end of June 2026, against 160,919 at the end of 2022, after 115,872 initial decisions in the year to June 2026.
United Kingdom · end of 2022 to end of June 2026
Hotel use has fallen: 16,021 people in asylum hotels at the end of June 2026, against 45,753 at the end of 2022.
United Kingdom · end of 2022 to end of June 2026
Weaknesses · 5 findings
The Home Office spent about £4.2 billion on asylum support, resettlement and accommodation in 2025-26, a short-term cost paid while claims are decided. Small-boat arrivals were about 5% of the number arriving in 2025 but account for much of public attention to this cost.
United Kingdom · 2025-26
NAO found no firm shared outcomes across the asylum system and insufficient interoperable data. Faster processing can shift backlogs elsewhere or reduce decision quality; progress must cover the whole case, including appeals and accommodation.
United Kingdom · NAO, December 2025
Worker protection matters alongside migration totals. The 2023 social-care immigration inspection identified weaknesses in sponsor licensing and compliance capacity, alongside exploitation and abuse. It is evidence of a delivery risk, not a current prevalence estimate.
United Kingdom · Inspection, August–November 2023 · risk
Decision quality has fallen as output rose: only 52% of decisions met the Home Office’s own quality standards in 2023/24, down from 76% two years before.
United Kingdom · 2021/22 and 2023/24
The queue has moved to appeals: around 80,000 asylum appeals were pending at the First-tier Tribunal at the end of 2025, a record.
United Kingdom · End of 2025
Opportunities · 1 finding
Judging asylum casework on sound decisions and end-to-end time, and checking local funding against observed demand, would tackle delay and local pressure without assuming any particular migration total is the goal.
Depends on: Appeals, legal advice and move-on housing are funded with casework, and funding comparisons show the councils that would lose as well as gain.
our synthesis
Threats · 1 finding
Backlogs can move rather than clear: appeals have built up as initial decisions rose, and ending hotel use depends on accommodation contracts whose estimated 10-year cost rose from £4.5bn to £15.3bn.
risk
Domain action plan
Proposed
Possible steps for government and the bodies responsible. These describe the order of work, not promised dates: starting an action and seeing results take different amounts of time.
Short term · prepare
Separate work, study, asylum and settlement pressures.
Medium term · deliver
Assess changes against staffing, service capacity and people’s rights.
Long term · judge results
Check the effects on living standards and services; evidence gaps remain.
Delivery steps and owners (4)
- Prerequisite: Publish cases by stage, avoidable delays and quality-audit results · Home Office with HM Courts & Tribunals Service · proposed
- Decision: Fund tribunal, legal-aid and move-on capacity alongside casework · Home Office, Ministry of Justice and MHCLG · proposed
- Delivery: Publish an annual demand-and-funding comparison for fast-changing areas · MHCLG with DfE, DHSC and the ONS · proposed
- Result: Shorter time to a final outcome without more overturned decisions; fewer people in hotels · Home Office and tribunal statistics · proposed
Sources, method and changes
Shareable visual summary
Visual summary
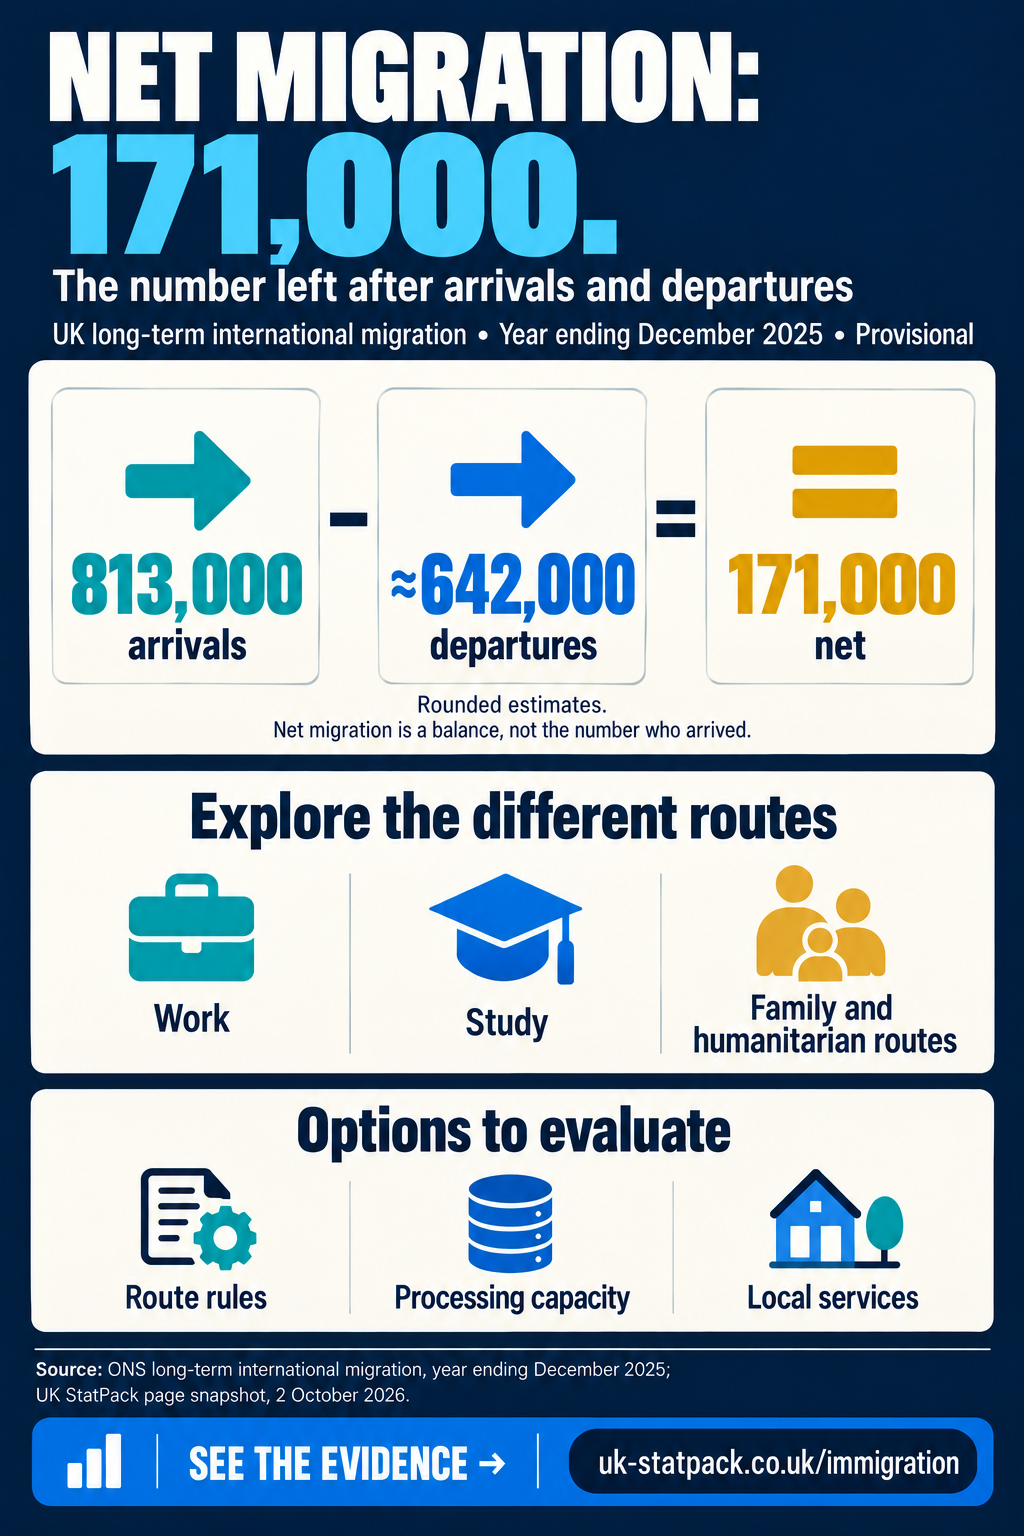
Net migration has fallen by more than three-quarters from its peak, to 171,000. Small-boat arrivals are about one in 20 of the people arriving.
Provisional ONS estimates for the year ending December 2025: 813,000 arrivals minus 642,000 departures = 171,000 net, down from a revised 331,000 a year earlier. Net is the difference between two flows; arrivals did not halve.
Long-term migration, year ending December 2025 (provisional)
813,000arrived−642,000left=171,000net migration
Text and data version
Net migration has fallen by more than three-quarters from its peak, to 171,000. Small-boat arrivals are about one in 20 of the people arriving. Provisional ONS estimates for the year ending December 2025: 813,000 arrivals minus 642,000 departures = 171,000 net, down from a revised 331,000 a year earlier. Net is the difference between two flows; arrivals did not halve.
| Measure | Value | Period | Geography | Type | Source |
|---|---|---|---|---|---|
| Long-term immigration | 813,000 | YE Dec 2025 | United Kingdom | administrative-data estimate (provisional) | Office for National Statistics, Long-term international migration, provisional, Table 1 |
| Long-term emigration | 642,000 | YE Dec 2025 | United Kingdom | administrative-data estimate (provisional) | Office for National Statistics, Long-term international migration, provisional, Table 1 |
| Net migration | 171,000 | YE Dec 2025 | United Kingdom | administrative-data estimate (provisional) | Office for National Statistics, Long-term international migration, provisional, Table 1 |
Image description: Immigration infographic: provisional net migration of 171,000 in the year ending December 2025 — 813,000 arrivals minus about 642,000 departures.
Available images and their source records are listed on Shareable visuals.
Sources and methods (13)
- ONS, Long-term international migration, provisional: year ending December 2025 (released 21 May 2026) — headline figures, peaks and the "nearly halved" comparison
- ONS, Long-term international migration, provisional (dataset), Tables 1 and 2 (released 21 May 2026) — immigration, emigration and net migration (Table 1); 95% ranges (Table 2); revisions (Table 5)
- ONS, Long-term international migration, provisional (dataset), Table 4b (released 21 May 2026) — non-EU+ immigration by reason
- Home Office, Immigration system statistics: asylum summary tables, year ending June 2026, Asy_00a (released 27 August 2026) — asylum claims, decisions, people awaiting a decision, support, hotels and returns
- Home Office, Immigration system statistics: illegal entry routes summary tables, year ending June 2026, IER_01 (released 27 August 2026) — detected small-boat arrivals
- ONS, Mid-year population estimates, England and Wales: mid-2025, Table MYE3 (components of change) (released 29 July 2026) — international and internal migration by region
- ONS, Measuring illegal migration: our current view (June 2019) — why there is no official estimate of the population living here without permission
- Home Office, Restoring control over the immigration system: white paper and technical annex (May 2025) — policy options
- HM Treasury, Spending Review 2025 (June 2025) — policy options
- National Audit Office, The Home Office’s asylum accommodation contracts (May 2025) — policy options
- Home Office, First illegal migrants returned under new UK-France agreement (October 2025) — policy options
- Migration Advisory Committee, EEA migration in the UK: final report (September 2018) — policy options
- OBR, The impact of migration on the fiscal forecast (Economic and fiscal outlook, March 2024) — policy options
Method notes
- Long-term migration counts people moving for 12 months or more. ONS estimates are "official statistics in development", built from Home Office visa and travel records and DWP/HMRC data; the latest year is provisional and is revised as more travel data arrive.
- Net migration is immigration minus emigration. It is not the number of people arriving, and it cannot be compared with arrival counts from other sources.
- The by-reason breakdown covers non-EU+ nationals only. British and EU+ arrivals are not split by reason.
- Home Office asylum and small-boat figures are administrative counts of claims, decisions and detected arrival events, on calendar years or years to June. They are not components of long-term migration and are never used here as a share of it.
- Regional figures come from ONS mid-year population estimates (mid-2024 to mid-2025, England and Wales), which use a different period and method from the UK series.
Corrections and changes
- 2026-10-11: Removed an unsupported inference that London’s total population fell: the figure describes net internal migration only. Corrected visual records to administrative-data estimates and made the asylum badge’s recent comparison explicit.