The data in one image
Visual summaries retain their source context and link back to the full analysis — one shareable page per subject, for the UK, Hampshire and its cities.
Prefer to watch? Watch UK Facts films, with captions and sources →
Social cards
Six landscape cards, each tied to its own page. Post them with the page link: an uploaded image does not link back by itself. Reflowed 1200×630, 1080×1350 and 1080×1920 versions are built from the same records.

An English home cost 7.6 times median gross full-time annual earnings in 2025. The ratio improved from its peak, but buying still presents a high barrier. Explore prices, rents and supply.
Download PNG for housing1200×630 card for housing1080×1350 card for housing1080×1920 card for housing
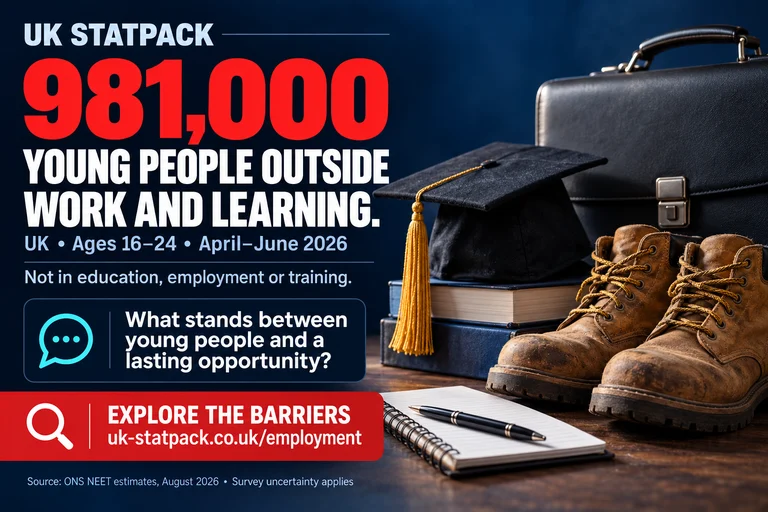
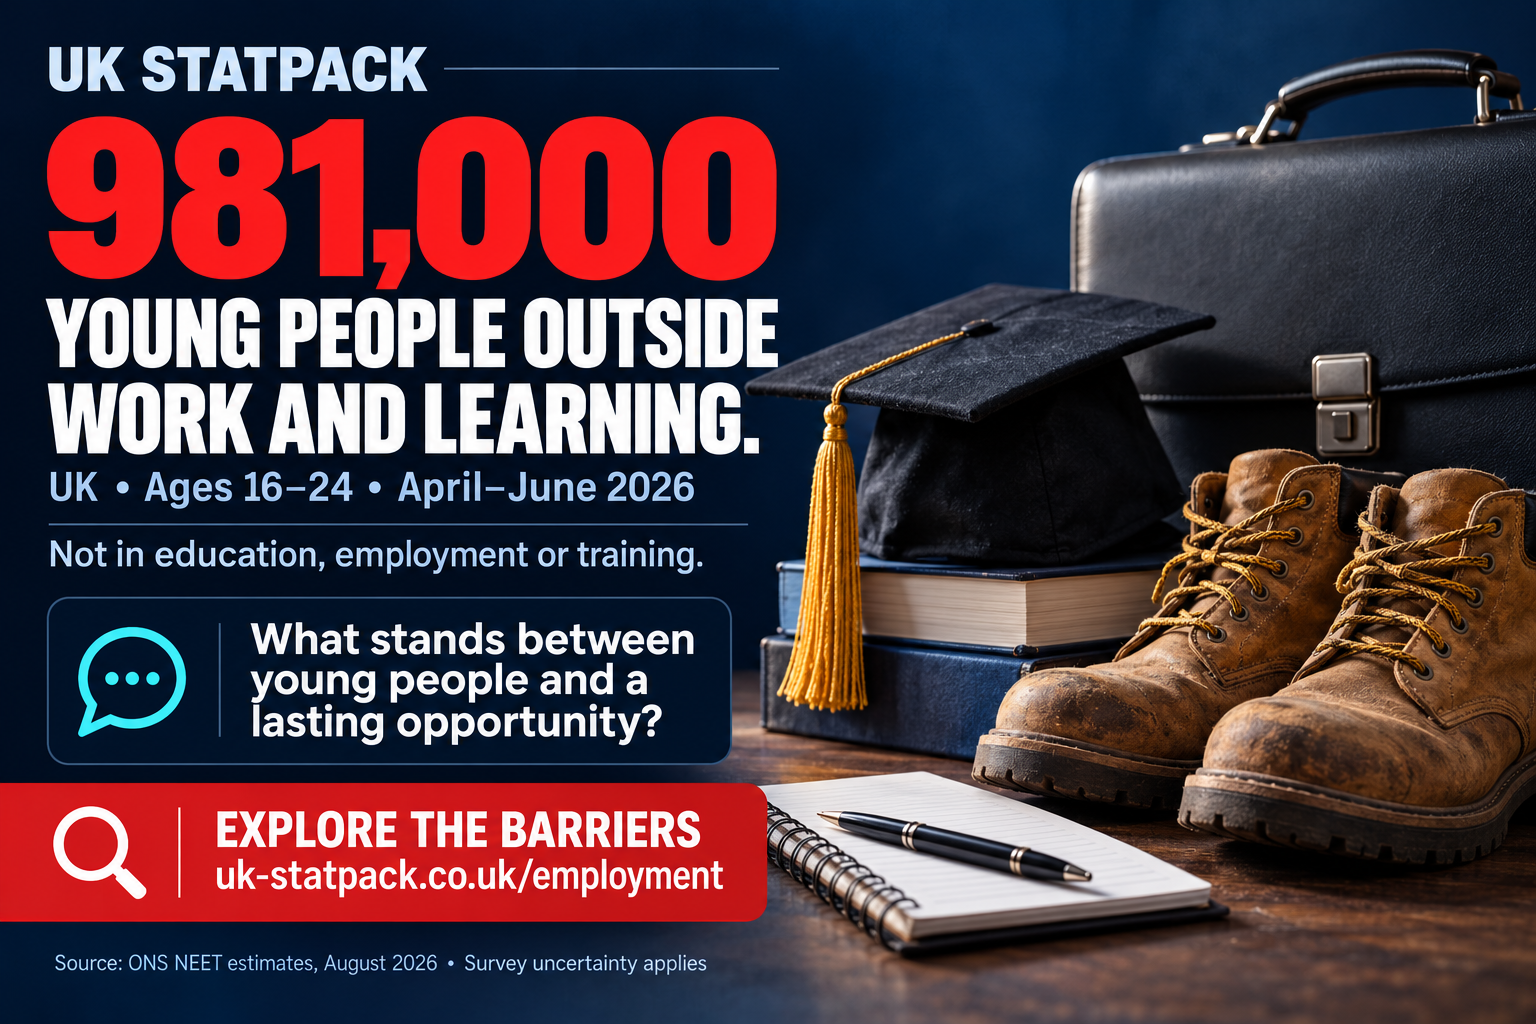
An estimated 981,000 UK 16–24-year-olds were outside education, employment or training in April–June 2026. What barriers stand in the way of a lasting opportunity? Read the data and possible responses.
Download PNG for employment1200×630 card for employment1080×1350 card for employment1080×1920 card for employment
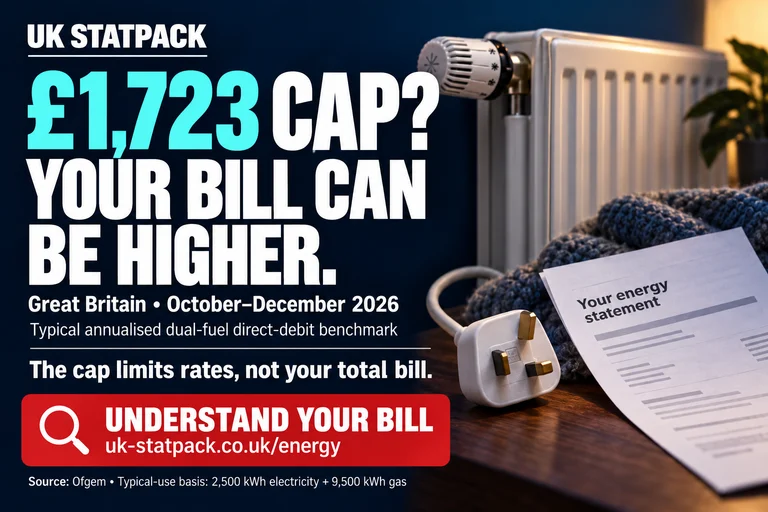
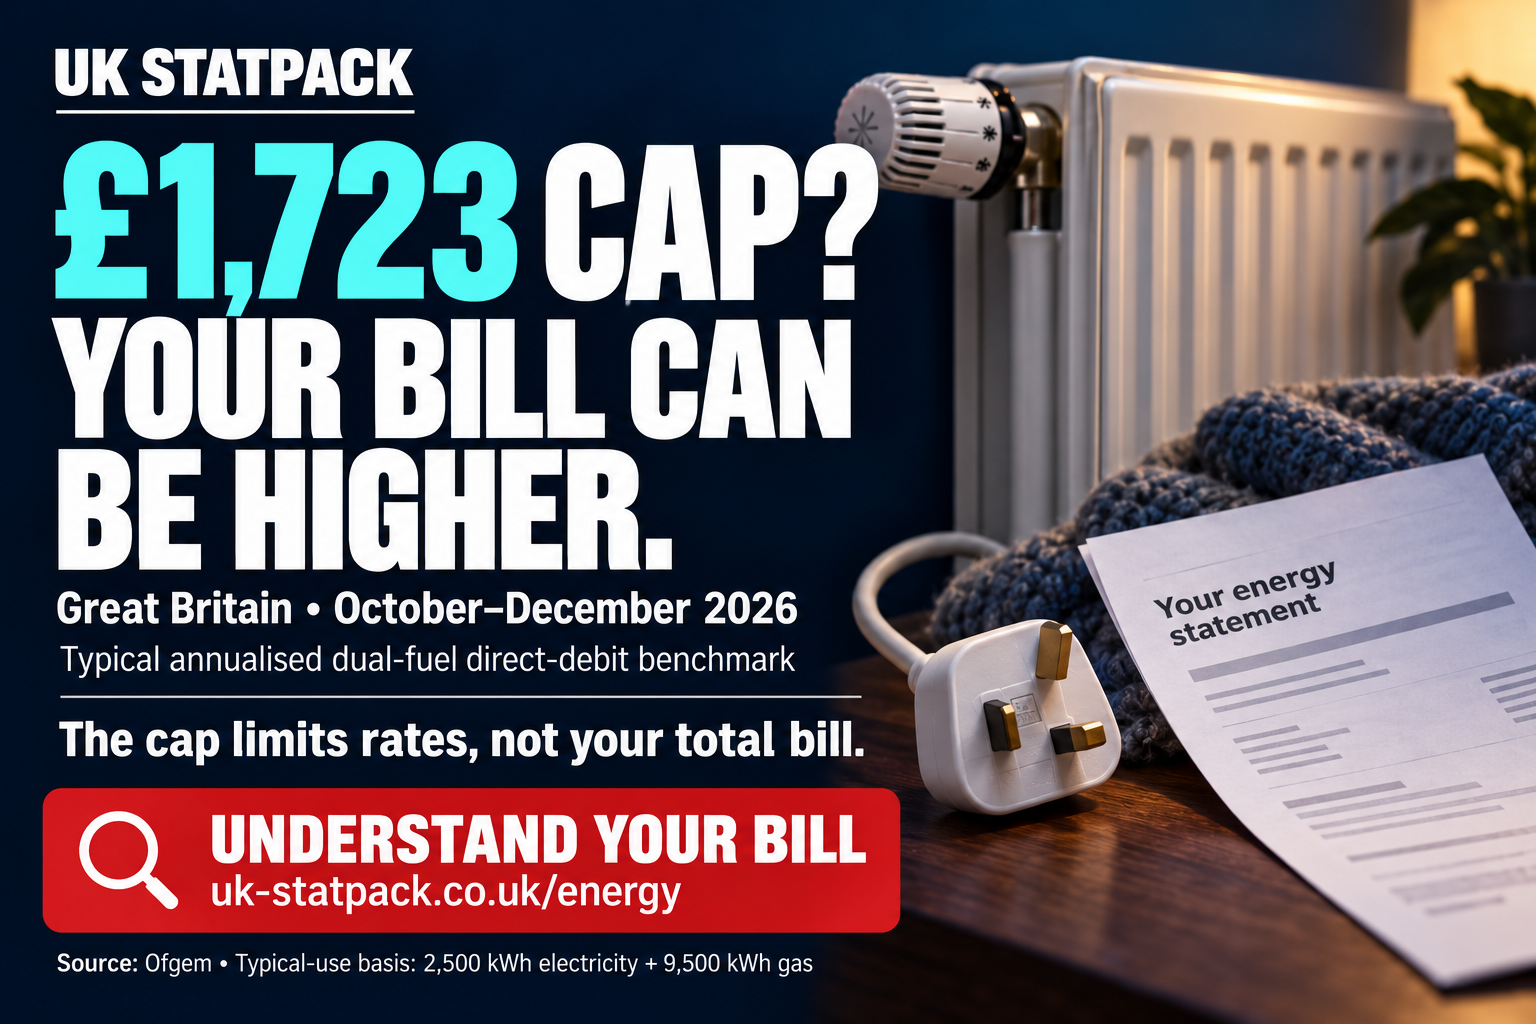
The £1,723 energy-cap figure is a typical-use annualised benchmark for Great Britain, October–December 2026. It limits rates, not your total bill. Understand the assumptions and what your usage changes.
Download PNG for energy1200×630 card for energy1080×1350 card for energy1080×1920 card for energy

Visual summaries by page
10 available statistical images and 4 editorial explainers. An image is available only when every figure it prints matches today’s record and its primary sources have been checked; otherwise the page shows a chart drawn from the records instead.
| Page | Type | Records behind it |
|---|---|---|
| /housingHomes still cost nearly eight years of full-time pay. | Statistical image |
|
| /economyMean weekly pay buys 4.6% more than in 2007. | Statistical image |
|
| /immigrationNet migration has fallen by more than three-quarters from its peak, to 171,000. Small-boat arrivals are about one in 20 of the people arriving. | Statistical image |
|
| /energyA year of typical energy use costs £1,723, £744 more than in 2021. | Statistical image |
|
| /follow-the-money£1.37 trillion spent. What can Britain change? | Statistical image |
|
| /brexitThe OBR’s 4% compares two futures — it is not an observed fall. | Statistical image |
|
| /innovation£79bn on research. Spending is only the beginning. | Statistical image |
|
| /ai-resilienceThe US attracted 48 times more private investment in AI than Britain in 2025. | Statistical image |
|
| /politics/electoral-systemLabour won a third of the vote—and nearly two-thirds of the seats. | Statistical image |
|
| /manifestoOf eleven selected 2024 Labour pledges, three are on track, six are mixed and one is off track. | Statistical image |
|
| /revenue-opportunityA big number is not a costed revenue plan. | Editorial explainer | Editorial — no statistic |
| /public-procurementAnnouncing a rule is not delivering a better service. | Editorial explainer | Editorial — no statistic |
| /politics/partiesSeven party profiles. One standard of evidence. | Editorial explainer | Editorial — no statistic |
| /politics/pollingA poll is a snapshot. A small move may be noise. | Editorial explainer | Editorial — no statistic |
New — Put It In Scale
Not a topic summary — one claim, checked.
The pages below summarise a whole subject in one image. Put It In Scale is different: each card takes one specific claim people actually repeat — “8.4 million on Universal Credit”, “Labour won on a minority of the vote” — and shows the number that puts it in context, in about ten seconds.
See Put It In Scale →Earlier topic summaries
One shareable summary per subject, each built from the same verified figures as the full analysis page — with a downloadable poster.
NHS
7.37m
End August 2026
Waiting lists, A&E performance and the pressures behind the headlines.
View and share →Crime
48,774
Year ending March 2026
What has fallen, what has risen, and where the exceptions are.
View and share →Housing
£273,000
August 2026
Prices, supply and affordability — the three numbers that set the market.
View and share →Economy
3.5%
September 2026
Growth, inflation and the productivity problem underneath both.
View and share →Jobs & pay
16.4%
May–July 2026
Employment looks strong; pay and inactivity tell a more complicated story.
View and share →Immigration
171k
YE Dec 2025
Net migration, who arrives, and what the illegal-entry figures do and do not measure.
View and share →Public finances
94.0%
End September 2026
Debt, deficit and the cost of servicing what the state has borrowed.
View and share →Inequality
27%
2024/25
How income is distributed, and how many children fall below the poverty line.
View and share →By area
Britain in one view
A national overview of the figures shaping everyday life.
View and share →Hampshire in one image
Population, housing, jobs, deprivation, crime and GP access across all 13 authorities, live from the data registry.
View and share →Portsmouth in one image
The city’s housing, jobs, public services and local context.
View and share →Southampton in one image
Population, housing, jobs, deprivation, crime and GP access, live from the data registry.
View and share →Winchester in one image
Population, housing, jobs, deprivation, crime and GP access, live from the data registry.
View and share →