1996
£48,693
Mean purchase price
- Mean mortgage
- £43,867
- Mean loan-to-value
- 90.11%
Deposit illustration
£4,816
Using this price and 9.89% cash; not the observed average deposit.
Headline evidence · Housing · England · 2025
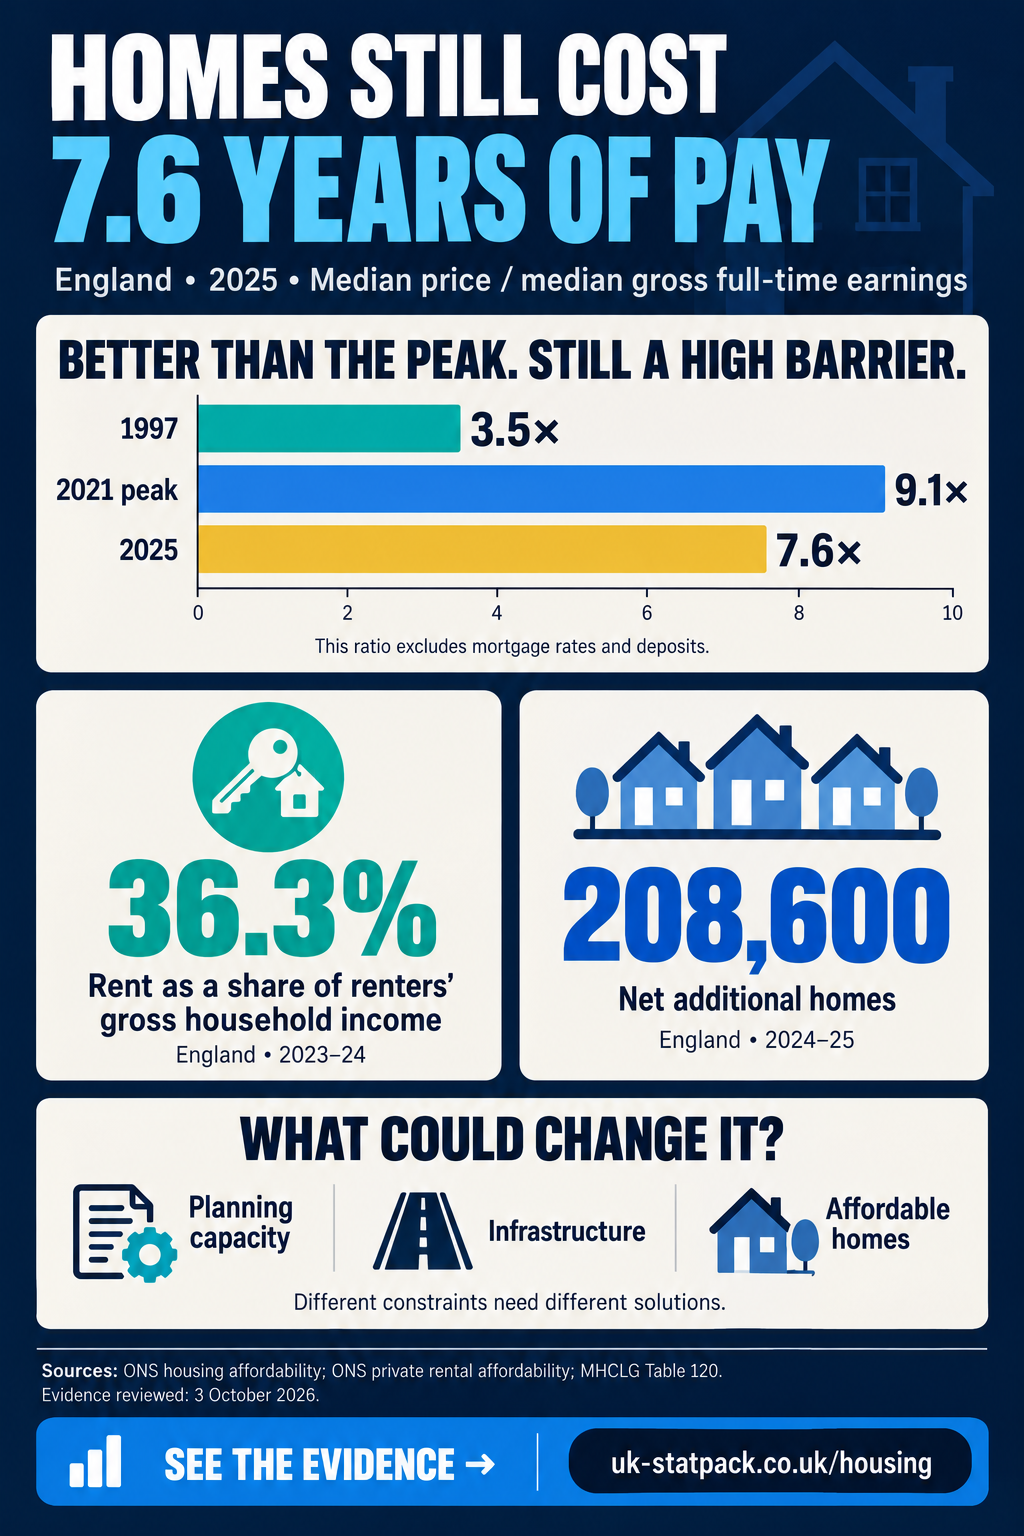
Median price over median full-time pay at England’s workplaces; 1997 earnings are annualised from weekly figures. Private renters spend about 36% of their household’s income before tax on rent, and 177,530 children are in temporary accommodation (March 2026, provisional).
Proposed outcome: Help more people find affordable, secure homes and prevent homelessness. What could change →
How many years of pay does a typical home cost?
1996–2026 · recorded figures.
Buying a home takes a much larger share of pay than in 1997. The recent improvement does not tell us whether deposits or monthly mortgage payments are affordable.
England · median house price ÷ median full-time annual earnings. The early earnings basis differs in 1997–98.
Prices rose much faster than pay before 2007. The ratio peaked at 9.1× in 2021 and has since fallen to 7.6×. That does not measure the deposit or monthly mortgage payment.
Source: ONS, Housing affordability in England and Wales: 2025, dataset Table 1c (released 26 March 2026).
| Year | Ratio |
|---|---|
| 1997 | 3.54 |
| 1998 | 3.67 |
| 1999 | 3.96 |
| 2000 | 4.19 |
| 2001 | 4.50 |
| 2002 | 5.12 |
| 2003 | 5.93 |
| 2004 | 6.60 |
| 2005 | 6.79 |
| 2006 | 6.95 |
| 2007 | 7.15 |
| 2008 | 6.97 |
| 2009 | 6.40 |
| 2010 | 6.85 |
| 2011 | 6.80 |
| 2012 | 6.77 |
| 2013 | 6.76 |
| 2014 | 7.09 |
| 2015 | 7.54 |
| 2016 | 7.72 |
| 2017 | 7.91 |
| 2018 | 8.04 |
| 2019 | 7.88 |
| 2020 | 7.86 |
| 2021 | 9.06 |
| 2022 | 8.56 |
| 2023 | 8.45 |
| 2024 | 7.84 |
| 2025 | 7.63 |
The cost of renting
36.3%
Private rents take a large share of renters’ income before tax. London is more expensive still.
England · 2023–24
Mean private rent ÷ median gross renter-household income. 41.6% in London.
Published statistics · ONS, Private rental affordability, England, Wales and Northern Ireland: 2024, dataset Table 3
Children without a settled home
177,530children
Children living in temporary accommodation arranged by councils. This provisional count does not include every child without a secure home.
England · March 2026
In council-arranged temporary accommodation; 135,580 households in total. Provisional.
Provisional · MHCLG, Statutory homelessness: England time series, Table TA1
Budget 2026 · 28 October 2026
11
Budget measures on this topic
£90m
Net cost, 2026–27
£120m
Net cost, 2029–30
Biggest single-year effect of each measure · red costs money, teal saves or raises it
−£580m
cost in 2028–29
Rough Sleeping
+£575m
saving or gain in 2028–29
Property Income
−£500m
cost in 2028–29
Social and Affordable Homes Programme
+£405m
saving or gain in 2027–28
Rough Sleeping
+£235m
saving or gain in 2031–32
First Time Buyer ISA
+£95m
saving or gain in 2028–29
Your First Home
−£70m
cost in 2028–29
Supported Housing
−£60m
cost in 2029–30
Cambridge Development Corporation
−£50m
cost in 2030–31
High Value Council Tax Surcharge
−£25m
cost in 2029–30
Lifetime ISA
−£15m
cost in 2027–28
Social Housing
Treasury costings certified by the OBR, not measured results. Topic links are UK Facts’ classification.
Buying
A lower house-price ratio does not necessarily mean an affordable monthly payment. Start with the price, then follow the money needed to buy.
England; comparable published observations begin in 1997. The 1997–98 denominators annualise weekly earnings; later years use annual earnings. No 1996 observation is supplied. The ratio excludes interest rates and deposits. A dash means no comparable observation is supplied; it is not zero. These are population medians, not a particular household’s income or mortgage.
1996–2026; Median house price / median full-time annual workplace earnings. No change is calculated across definition or assessment breaks.
| Year | Price / earnings |
|---|---|
| 1996 | No comparable observations supplied |
| 1997 | 3.5 |
| 1998 | 3.7 |
| 1999 | 4 |
| 2000 | 4.2 |
| 2001 | 4.5 |
| 2002 | 5.1 |
| 2003 | 5.9 |
| 2004 | 6.6 |
| 2005 | 6.8 |
| 2006 | 7 |
| 2007 | 7.2 |
| 2008 | 7 |
| 2009 | 6.4 |
| 2010 | 6.9 |
| 2011 | 6.8 |
| 2012 | 6.8 |
| 2013 | 6.8 |
| 2014 | 7.1 |
| 2015 | 7.5 |
| 2016 | 7.7 |
| 2017 | 7.9 |
| 2018 | 8 |
| 2019 | 7.9 |
| 2020 | 7.9 |
| 2021 | 9.1 |
| 2022 | 8.6 |
| 2023 | 8.5 |
| 2024 | 7.8 |
| 2025 | 7.6 |
| 2026 | No comparable observations supplied |
How much did first-time buyers borrow against income?
UK · loan-to-income ratio for completed first-time buyer mortgages. Two sources; not one continuous series.
1996–2026 · recorded figures.
Archive source: Table 517 (XLS). Survey changes in 2003 and 2005; sources overlap in 2006–10.
Source: ONS, First-time buyer mortgage sales by local authority: UK, 2b, United Kingdom.
| Year | Archived Table 517 | ONS/FCA Table 2b |
|---|---|---|
| 1996 | 2.42 | — |
| 1997 | 2.43 | — |
| 1998 | 2.41 | — |
| 1999 | 2.44 | — |
| 2000 | 2.46 | — |
| 2001 | 2.52 | — |
| 2002 | 2.679 | — |
| 2003 | 2.96 | — |
| 2004 | 3.36 | — |
| 2005 | 3.39 | — |
| 2006 | 3.2 | 3.25 |
| 2007 | 3.35 | 3.39 |
| 2008 | 3.247 | 3.28 |
| 2009 | 3.017 | 3.11 |
| 2010 | 3.073 | 3.23 |
| 2011 | — | 3.21 |
| 2012 | — | 3.27 |
| 2013 | — | 3.34 |
| 2014 | — | 3.43 |
| 2015 | — | 3.44 |
| 2016 | — | 3.56 |
| 2017 | — | 3.62 |
| 2018 | — | 3.66 |
| 2019 | — | 3.67 |
| 2020 | — | 3.71 |
| 2021 | — | 3.75 |
| 2022 | — | 3.79 |
| 2023 | — | 3.47 |
| 2024 | — | 3.47 |
| 2025 | — | 3.62 |
The next hurdle: cash up front
UK first-time buyers · nominal pounds. The archive gives means; the current release gives medians. The different measures provide context, not a precise growth rate.
1996
£48,693
Mean purchase price
Deposit illustration
£4,816
Using this price and 9.89% cash; not the observed average deposit.
2025
£240,000
Median purchase price
Deposit illustration
£34,512
Using this price and 14.38% cash; not the observed average deposit.
Deposits were not fixed at 10%. The median first-time buyer LTV was 90% in 2007. Some products went further: Northern Rock’s Together combined a mortgage with an unsecured loan, allowing total borrowing up to 125% of the property value.
Successful UK mortgage buyers only, not all homes or people unable to buy. Archive: Table 513 (price and advance) and Table 517 (case-level LTV). Current: ONS/FCA tables 2a, 3b and 3c. Means and medians are not interchangeable. The cash illustration applies each period’s published LTV to its price, assumes valuation equals price, and excludes fees and taxes. Separate medians must not be subtracted to claim a median deposit.
High-LTV products were not the typical loan and do not, on their own, explain the financial crisis. Northern Rock also depended on wholesale funding that dried up.
Commons Library: Northern RockSeparate savings illustration: Under the same two-earner saving rule, a 10% deposit takes 21 months in 1997 and 46 in 2025: 25 extra months (+116%). A fictional family and an illustrative calculation using ONS data.
The saving model, assumptions and illustrated story →What does the size of your deposit change?
UK · quoted two-year fixed rates, 1996–Sept 2026. LTV is the share of the property price borrowed.
1996–2026 · recorded figures.
Source: Bank of England, quoted household interest rates, IUMBV34 (75%), IUMB482 (90%), IUM2WTL (95%).
| Month | 75% LTV (%) | 90% LTV (%) | 95% LTV (%) |
|---|---|---|---|
| Jan 1996 | 6.7 | Not available | 6.7 |
| Feb 1996 | 6.65 | Not available | 6.65 |
| Mar 1996 | 6.49 | Not available | 6.49 |
| Apr 1996 | 6.62 | Not available | 6.62 |
| May 1996 | 7.01 | Not available | 7.01 |
| Jun 1996 | 7.06 | Not available | 7.06 |
| Jul 1996 | 7.12 | Not available | 7.12 |
| Aug 1996 | 7.09 | Not available | 7.09 |
| Sept 1996 | 7.06 | Not available | 7.06 |
| Oct 1996 | 6.96 | Not available | 6.96 |
| Nov 1996 | 6.94 | Not available | 6.94 |
| Dec 1996 | 7.24 | Not available | 7.27 |
| Jan 1997 | 7.29 | Not available | 7.35 |
| Feb 1997 | 7.35 | Not available | 7.41 |
| Mar 1997 | 7.11 | Not available | 7.18 |
| Apr 1997 | 7.24 | Not available | 7.3 |
| May 1997 | 7.15 | Not available | 7.2 |
| Jun 1997 | 7.14 | Not available | 7.19 |
| Jul 1997 | 7.2 | Not available | 7.23 |
| Aug 1997 | 7.17 | Not available | 7.19 |
| Sept 1997 | 7.06 | Not available | 7.09 |
| Oct 1997 | 7.07 | Not available | 7.1 |
| Nov 1997 | 7.04 | Not available | 7.06 |
| Dec 1997 | 7.13 | Not available | 7.33 |
| Jan 1998 | 7.13 | Not available | 7.33 |
| Feb 1998 | 7.08 | Not available | 7.32 |
| Mar 1998 | 7.02 | Not available | 7.26 |
| Apr 1998 | 7.14 | Not available | 7.28 |
| May 1998 | 7.12 | Not available | 7.35 |
| Jun 1998 | 6.94 | Not available | 7.24 |
| Jul 1998 | 7.08 | Not available | 7.35 |
| Aug 1998 | 7.33 | Not available | 7.55 |
| Sept 1998 | 7.27 | Not available | 7.49 |
| Oct 1998 | 6.91 | Not available | 7.01 |
| Nov 1998 | 6.66 | Not available | 6.82 |
| Dec 1998 | 6.42 | Not available | 6.54 |
| Jan 1999 | 5.9 | Not available | 5.97 |
| Feb 1999 | 5.78 | Not available | 5.88 |
| Mar 1999 | 5.64 | Not available | 5.95 |
| Apr 1999 | 5.71 | Not available | 5.89 |
| May 1999 | 5.72 | Not available | 5.96 |
| Jun 1999 | 5.89 | Not available | 6 |
| Jul 1999 | 6 | Not available | 6.17 |
| Aug 1999 | 6.19 | Not available | 6.36 |
| Sept 1999 | 6.22 | Not available | 6.45 |
| Oct 1999 | 6.5 | Not available | 6.79 |
| Nov 1999 | 6.6 | Not available | 6.77 |
| Dec 1999 | 6.52 | Not available | 6.84 |
| Jan 2000 | 6.78 | Not available | 6.9 |
| Feb 2000 | 6.79 | Not available | 6.97 |
| Mar 2000 | 6.45 | Not available | 6.68 |
| Apr 2000 | 6.31 | Not available | 6.64 |
| May 2000 | 6.39 | Not available | 6.52 |
| Jun 2000 | 6.46 | Not available | 6.65 |
| Jul 2000 | 6.37 | Not available | 6.59 |
| Aug 2000 | 6.35 | Not available | 6.58 |
| Sept 2000 | 6.31 | Not available | 6.6 |
| Oct 2000 | 6.05 | Not available | 6.45 |
| Nov 2000 | 6.06 | Not available | 6.29 |
| Dec 2000 | 6.03 | Not available | 6.22 |
| Jan 2001 | 5.78 | Not available | 6 |
| Feb 2001 | 5.7 | Not available | 5.85 |
| Mar 2001 | 5.68 | Not available | 5.82 |
| Apr 2001 | 5.63 | Not available | 5.76 |
| May 2001 | 5.65 | Not available | 5.71 |
| Jun 2001 | 5.72 | Not available | 5.82 |
| Jul 2001 | 5.92 | Not available | 6.16 |
| Aug 2001 | 5.58 | Not available | 6 |
| Sept 2001 | 5.39 | Not available | 5.59 |
| Oct 2001 | 5.06 | Not available | 5.53 |
| Nov 2001 | 4.84 | Not available | 5.31 |
| Dec 2001 | 4.98 | Not available | 5.21 |
| Jan 2002 | 5.06 | Not available | 5.34 |
| Feb 2002 | 5.14 | Not available | 5.47 |
| Mar 2002 | 5.22 | Not available | 5.47 |
| Apr 2002 | 5.35 | Not available | 5.62 |
| May 2002 | 5.43 | Not available | 5.67 |
| Jun 2002 | 5.41 | Not available | 5.65 |
| Jul 2002 | 5.3 | Not available | 5.55 |
| Aug 2002 | 4.59 | Not available | 4.92 |
| Sept 2002 | 4.5 | Not available | 4.72 |
| Oct 2002 | 4.43 | Not available | 4.69 |
| Nov 2002 | 4.45 | Not available | 4.68 |
| Dec 2002 | 4.62 | Not available | 4.86 |
| Jan 2003 | 4.5 | Not available | 4.69 |
| Feb 2003 | 4.14 | Not available | 4.36 |
| Mar 2003 | 4.06 | Not available | 4.2 |
| Apr 2003 | 4.06 | Not available | 4.31 |
| May 2003 | 3.91 | Not available | 4.18 |
| Jun 2003 | 3.85 | Not available | 4.04 |
| Jul 2003 | 3.87 | Not available | 4.08 |
| Aug 2003 | 4.32 | Not available | 4.63 |
| Sept 2003 | 4.56 | Not available | 4.86 |
| Oct 2003 | 4.98 | Not available | 5.21 |
| Nov 2003 | 5.1 | Not available | 5.34 |
| Dec 2003 | 5.05 | Not available | 5.32 |
| Jan 2004 | 4.95 | Not available | 5.19 |
| Feb 2004 | 4.89 | Not available | 5.12 |
| Mar 2004 | 4.9 | Not available | 5.17 |
| Apr 2004 | 5.11 | Not available | 5.37 |
| May 2004 | 5.18 | Not available | 5.33 |
| Jun 2004 | 5.52 | Not available | 5.76 |
| Jul 2004 | 5.53 | Not available | 5.69 |
| Aug 2004 | 5.47 | Not available | 5.66 |
| Sept 2004 | 5.33 | Not available | 5.63 |
| Oct 2004 | 5.29 | Not available | 5.6 |
| Nov 2004 | 5.06 | Not available | 5.42 |
| Dec 2004 | 5.07 | Not available | 5.31 |
| Jan 2005 | 4.99 | Not available | 5.3 |
| Feb 2005 | 5.07 | Not available | 5.31 |
| Mar 2005 | 5.2 | Not available | 5.48 |
| Apr 2005 | 5.16 | Not available | 5.43 |
| May 2005 | 4.91 | Not available | 5.27 |
| Jun 2005 | 4.77 | Not available | 5.01 |
| Jul 2005 | 4.59 | Not available | 4.76 |
| Aug 2005 | 4.56 | Not available | 4.75 |
| Sept 2005 | 4.52 | Not available | 4.74 |
| Oct 2005 | 4.54 | Not available | 4.78 |
| Nov 2005 | 4.74 | Not available | 4.98 |
| Dec 2005 | 4.74 | Not available | 5.04 |
| Jan 2006 | 4.62 | Not available | 4.96 |
| Feb 2006 | 4.71 | Not available | 5.01 |
| Mar 2006 | 4.72 | Not available | 5.04 |
| Apr 2006 | 4.77 | Not available | 5.03 |
| May 2006 | 5 | Not available | 5.23 |
| Jun 2006 | 5 | Not available | 5.31 |
| Jul 2006 | 5.01 | Not available | 5.39 |
| Aug 2006 | 5.1 | Not available | 5.42 |
| Sept 2006 | 5.1 | Not available | 5.44 |
| Oct 2006 | 4.99 | Not available | 5.39 |
| Nov 2006 | 5.2 | Not available | 5.51 |
| Dec 2006 | 5.15 | Not available | 5.44 |
| Jan 2007 | 5.32 | Not available | 5.68 |
| Feb 2007 | 5.46 | Not available | 5.82 |
| Mar 2007 | 5.55 | Not available | 5.88 |
| Apr 2007 | 5.62 | Not available | 5.86 |
| May 2007 | 5.7 | Not available | 6.05 |
| Jun 2007 | 5.98 | Not available | 6.26 |
| Jul 2007 | 6.07 | Not available | 6.33 |
| Aug 2007 | 6.11 | Not available | 6.54 |
| Sept 2007 | 6.05 | Not available | 6.32 |
| Oct 2007 | 6.11 | Not available | 6.44 |
| Nov 2007 | 6.09 | Not available | 6.47 |
| Dec 2007 | 6.06 | Not available | 6.54 |
| Jan 2008 | 5.97 | Not available | 6.41 |
| Feb 2008 | 5.74 | Not available | 6.52 |
| Mar 2008 | 5.8 | Not available | 6.59 |
| Apr 2008 | 6.06 | Not available | 6.91 |
| May 2008 | 6.26 | 6.44 | Not available |
| Jun 2008 | 6.6 | 6.67 | Not available |
| Jul 2008 | 6.35 | 6.94 | Not available |
| Aug 2008 | 6.08 | 6.8 | Not available |
| Sept 2008 | 5.96 | 6.56 | Not available |
| Oct 2008 | 5.83 | 6.41 | Not available |
| Nov 2008 | 5.1 | 6.58 | Not available |
| Dec 2008 | 4.77 | 6.69 | Not available |
| Jan 2009 | 4.35 | 6.13 | Not available |
| Feb 2009 | 4.35 | 5.97 | Not available |
| Mar 2009 | 3.98 | Not available | Not available |
| Apr 2009 | 4.02 | Not available | Not available |
| May 2009 | 3.98 | Not available | Not available |
| Jun 2009 | 4.45 | 6.47 | Not available |
| Jul 2009 | 4.42 | 6.47 | Not available |
| Aug 2009 | 4.43 | 6.44 | Not available |
| Sept 2009 | 4.47 | 6.42 | Not available |
| Oct 2009 | 4.32 | 6.55 | Not available |
| Nov 2009 | 4.1 | 6.62 | Not available |
| Dec 2009 | 4.05 | 6.64 | Not available |
| Jan 2010 | 3.97 | 6.61 | Not available |
| Feb 2010 | 3.88 | 6.62 | Not available |
| Mar 2010 | 3.92 | 6.61 | Not available |
| Apr 2010 | 3.82 | 6.65 | Not available |
| May 2010 | 3.78 | 6.63 | Not available |
| Jun 2010 | 3.67 | 6.6 | Not available |
| Jul 2010 | 3.77 | 6.52 | Not available |
| Aug 2010 | 3.74 | 6.35 | Not available |
| Sept 2010 | 3.8 | 6.27 | Not available |
| Oct 2010 | 3.68 | 6.14 | Not available |
| Nov 2010 | 3.53 | 6.16 | Not available |
| Dec 2010 | 3.5 | 6.15 | Not available |
| Jan 2011 | 3.7 | 6.18 | Not available |
| Feb 2011 | 3.7 | 5.92 | Not available |
| Mar 2011 | 3.68 | 5.91 | Not available |
| Apr 2011 | 3.66 | 5.98 | Not available |
| May 2011 | 3.51 | 5.93 | Not available |
| Jun 2011 | 3.36 | 5.77 | Not available |
| Jul 2011 | 3.14 | 5.75 | Not available |
| Aug 2011 | 3 | 5.5 | Not available |
| Sept 2011 | 2.92 | 5.27 | Not available |
| Oct 2011 | 3.04 | 5.31 | Not available |
| Nov 2011 | 3.14 | 5.37 | Not available |
| Dec 2011 | 3.22 | 5.45 | Not available |
| Jan 2012 | 3.27 | 5.53 | Not available |
| Feb 2012 | 3.37 | 5.6 | Not available |
| Mar 2012 | 3.44 | 5.76 | Not available |
| Apr 2012 | 3.66 | 5.79 | Not available |
| May 2012 | 3.68 | 6.07 | Not available |
| Jun 2012 | 3.74 | 5.7 | Not available |
| Jul 2012 | 3.67 | 5.83 | Not available |
| Aug 2012 | 3.69 | 5.93 | Not available |
| Sept 2012 | 3.67 | 5.85 | Not available |
| Oct 2012 | 3.49 | 5.64 | Not available |
| Nov 2012 | 3.43 | 5.64 | Not available |
| Dec 2012 | 3.35 | 5.39 | Not available |
| Jan 2013 | 3.11 | 4.86 | Not available |
| Feb 2013 | 2.92 | 4.73 | Not available |
| Mar 2013 | 2.9 | 4.67 | Not available |
| Apr 2013 | 2.87 | 4.67 | Not available |
| May 2013 | 2.69 | 4.61 | Not available |
| Jun 2013 | 2.63 | 4.59 | Not available |
| Jul 2013 | 2.62 | 4.58 | Not available |
| Aug 2013 | 2.58 | 4.52 | Not available |
| Sept 2013 | 2.54 | 4.56 | Not available |
| Oct 2013 | 2.48 | 4.42 | 5.1 |
| Nov 2013 | 2.44 | 4.41 | 5.04 |
| Dec 2013 | 2.4 | 4.36 | 5.08 |
| Jan 2014 | 2.37 | 4.34 | 5.05 |
| Feb 2014 | 2.38 | 4.39 | 5.05 |
| Mar 2014 | 2.37 | 4.38 | 5.06 |
| Apr 2014 | 2.54 | 4.48 | 5.14 |
| May 2014 | 2.56 | 4.49 | 5.2 |
| Jun 2014 | 2.6 | 4.5 | 5.32 |
| Jul 2014 | 2.54 | 4.47 | 5.33 |
| Aug 2014 | 2.54 | 4.34 | 5.28 |
| Sept 2014 | 2.46 | 4.23 | 5.28 |
| Oct 2014 | 2.21 | 3.98 | 5.2 |
| Nov 2014 | 2.17 | 3.84 | 5.27 |
| Dec 2014 | 2.08 | 3.89 | 5.27 |
| Jan 2015 | 2.01 | 3.71 | 4.74 |
| Feb 2015 | 1.96 | 3.77 | 4.67 |
| Mar 2015 | 1.99 | 3.74 | 4.72 |
| Apr 2015 | 1.95 | 3.53 | 4.58 |
| May 2015 | 1.9 | 3.53 | 4.57 |
| Jun 2015 | 1.83 | 3.34 | 4.39 |
| Jul 2015 | 1.87 | 3.26 | 4.32 |
| Aug 2015 | 1.95 | 3.15 | 4.36 |
| Sept 2015 | 1.91 | 3.03 | 4.22 |
| Oct 2015 | 1.87 | 2.89 | 4.22 |
| Nov 2015 | 1.92 | 2.88 | 4.13 |
| Dec 2015 | 1.9 | 2.87 | 4.06 |
| Jan 2016 | 1.93 | 2.85 | 3.95 |
| Feb 2016 | 1.95 | 2.88 | 3.99 |
| Mar 2016 | 1.9 | 2.87 | 3.92 |
| Apr 2016 | 1.84 | 2.71 | 3.92 |
| May 2016 | 1.91 | 2.75 | 3.93 |
| Jun 2016 | 1.75 | 2.64 | 3.88 |
| Jul 2016 | 1.72 | 2.57 | 3.85 |
| Aug 2016 | 1.69 | 2.55 | 3.88 |
| Sept 2016 | 1.59 | 2.42 | 3.84 |
| Oct 2016 | 1.52 | 2.42 | 3.73 |
| Nov 2016 | 1.43 | 2.49 | 3.66 |
| Dec 2016 | 1.45 | 2.53 | 3.62 |
| Jan 2017 | 1.45 | 2.5 | 3.62 |
| Feb 2017 | 1.42 | 2.45 | 3.8 |
| Mar 2017 | 1.37 | 2.48 | 3.99 |
| Apr 2017 | 1.35 | 2.43 | 4.04 |
| May 2017 | 1.49 | 2.5 | 4.19 |
| Jun 2017 | 1.48 | 2.5 | 4.2 |
| Jul 2017 | 1.41 | 2.37 | 4.07 |
| Aug 2017 | 1.43 | 2.33 | 4.02 |
| Sept 2017 | 1.4 | 2.31 | 4.01 |
| Oct 2017 | 1.55 | 2.36 | 4.02 |
| Nov 2017 | 1.61 | 2.36 | 3.97 |
| Dec 2017 | 1.57 | 2.21 | 3.89 |
| Jan 2018 | 1.54 | 2.17 | 3.82 |
| Feb 2018 | 1.49 | 2.21 | 3.82 |
| Mar 2018 | 1.53 | 2.2 | 3.77 |
| Apr 2018 | 1.72 | 2.36 | 3.9 |
| May 2018 | 1.74 | 2.34 | 3.95 |
| Jun 2018 | 1.74 | 2.37 | 3.95 |
| Jul 2018 | 1.75 | 2.3 | 3.78 |
| Aug 2018 | 1.75 | 2.28 | 3.61 |
| Sept 2018 | 1.71 | 2.12 | 3.38 |
| Oct 2018 | 1.8 | 2.27 | 3.33 |
| Nov 2018 | 1.75 | 2.28 | 3.23 |
| Dec 2018 | 1.73 | 2.24 | 3.18 |
| Jan 2019 | 1.72 | 2.23 | 3.04 |
| Feb 2019 | 1.7 | 2.17 | 2.99 |
| Mar 2019 | 1.7 | 2.17 | 2.97 |
| Apr 2019 | 1.66 | 2.15 | 2.92 |
| May 2019 | 1.65 | 2.19 | 2.93 |
| Jun 2019 | 1.64 | 2.18 | 2.95 |
| Jul 2019 | 1.61 | 2.15 | 2.96 |
| Aug 2019 | 1.59 | 2.1 | 2.96 |
| Sept 2019 | 1.55 | 2.09 | 2.99 |
| Oct 2019 | 1.47 | 2.07 | 2.99 |
| Nov 2019 | 1.41 | 2.08 | 2.99 |
| Dec 2019 | 1.42 | 2.07 | 3 |
| Jan 2020 | 1.41 | 2.05 | 3.02 |
| Feb 2020 | 1.4 | 1.97 | 3.02 |
| Mar 2020 | 1.4 | 1.94 | 3.02 |
| Apr 2020 | 1.38 | 1.89 | 3.07 |
| May 2020 | 1.42 | 1.96 | 3.17 |
| Jun 2020 | 1.41 | 2.19 | 2.72 |
| Jul 2020 | 1.45 | 2.5 | 2.58 |
| Aug 2020 | 1.6 | 2.78 | 3.78 |
| Sept 2020 | 1.75 | 3.29 | 3.95 |
| Oct 2020 | 1.94 | 3.52 | 4.13 |
| Nov 2020 | 1.92 | 3.72 | 4.2 |
| Dec 2020 | 1.86 | 3.75 | 4.2 |
| Jan 2021 | 1.75 | 3.63 | 4.16 |
| Feb 2021 | 1.61 | 3.49 | 4.1 |
| Mar 2021 | 1.56 | 3.38 | 4.16 |
| Apr 2021 | 1.49 | 3.38 | 4.01 |
| May 2021 | 1.47 | 3.31 | 3.88 |
| Jun 2021 | 1.39 | 3.09 | 3.74 |
| Jul 2021 | 1.29 | 2.79 | 3.53 |
| Aug 2021 | 1.23 | 2.48 | 3.43 |
| Sept 2021 | 1.2 | 2.16 | 3.22 |
| Oct 2021 | 1.29 | 2.04 | 2.98 |
| Nov 2021 | 1.53 | 2.02 | 2.91 |
| Dec 2021 | 1.57 | 1.95 | 2.77 |
| Jan 2022 | 1.64 | 1.95 | 2.73 |
| Feb 2022 | 1.78 | 2.03 | 2.72 |
| Mar 2022 | 2.14 | 2.38 | 2.8 |
| Apr 2022 | 2.35 | 2.58 | 2.95 |
| May 2022 | 2.63 | 2.85 | 3.2 |
| Jun 2022 | 2.87 | 3.15 | 3.48 |
| Jul 2022 | 3.48 | 3.69 | 3.96 |
| Aug 2022 | 3.6 | 3.93 | 4.14 |
| Sept 2022 | 4.17 | 4.48 | 4.67 |
| Oct 2022 | 5.99 | 6.2 | 6.42 |
| Nov 2022 | 5.98 | 6.28 | 6.59 |
| Dec 2022 | 5.43 | 6 | 6.3 |
| Jan 2023 | 5.14 | 5.66 | 6.02 |
| Feb 2023 | 4.79 | 5.35 | 5.86 |
| Mar 2023 | 4.74 | 5.23 | 5.77 |
| Apr 2023 | 4.6 | 5.07 | 5.65 |
| May 2023 | 4.72 | 5.08 | 5.67 |
| Jun 2023 | 5.49 | 5.75 | 6.28 |
| Jul 2023 | 6.22 | 6.49 | 6.88 |
| Aug 2023 | 6.18 | 6.57 | 6.93 |
| Sept 2023 | 5.91 | 6.37 | 6.75 |
| Oct 2023 | 5.6 | 6.06 | 6.6 |
| Nov 2023 | 5.28 | 5.81 | 6.38 |
| Dec 2023 | 5.03 | 5.69 | 6.18 |
| Jan 2024 | 4.71 | 5.44 | 5.87 |
| Feb 2024 | 4.76 | 5.26 | 5.73 |
| Mar 2024 | 4.96 | 5.39 | 5.83 |
| Apr 2024 | 4.98 | 5.47 | 5.87 |
| May 2024 | 5.19 | 5.66 | 6.04 |
| Jun 2024 | 5.16 | 5.65 | 6.07 |
| Jul 2024 | 4.99 | 5.61 | 5.97 |
| Aug 2024 | 4.8 | 5.54 | 5.9 |
| Sept 2024 | 4.58 | 5.4 | 5.76 |
| Oct 2024 | 4.4 | 5.3 | 5.61 |
| Nov 2024 | 4.53 | 5.41 | 5.69 |
| Dec 2024 | 4.6 | 5.37 | 5.7 |
| Jan 2025 | 4.63 | 5.35 | 5.69 |
| Feb 2025 | 4.65 | 5.26 | 5.64 |
| Mar 2025 | 4.54 | 5.09 | 5.44 |
| Apr 2025 | 4.42 | 4.96 | 5.29 |
| May 2025 | 4.18 | 4.82 | 5.1 |
| Jun 2025 | 4.28 | 4.8 | 5.1 |
| Jul 2025 | 4.21 | 4.62 | 5.05 |
| Aug 2025 | 4.1 | 4.55 | 5 |
| Sept 2025 | 4.19 | 4.58 | 5.03 |
| Oct 2025 | 4.2 | 4.57 | 5 |
| Nov 2025 | 4.06 | 4.49 | 4.91 |
| Dec 2025 | 3.97 | 4.42 | 4.83 |
| Jan 2026 | 3.93 | 4.36 | 4.8 |
| Feb 2026 | 3.97 | 4.34 | 4.82 |
| Mar 2026 | 4.45 | 4.79 | 5.23 |
| Apr 2026 | 5.14 | 5.46 | 5.8 |
| May 2026 | 4.91 | 5.31 | 5.63 |
| Jun 2026 | 4.8 | 5.18 | 5.54 |
| Jul 2026 | 4.79 | 5.07 | 5.48 |
| Aug 2026 | 4.92 | 5.16 | 5.52 |
| Sept 2026 | 5.13 | 5.37 | 5.7 |
Scroll the table sideways to see every column.
Delivery and safety · England; Housing Benefit changes also concern Scotland and Wales
Supported housing is more than a bed. Residents may need help to live independently; weak oversight can leave them paying for support they do not receive.
The June 2026 government response sets out licensing and support standards. These are implementation proposals, not evidence that poor provision has already been eliminated. Councils need inspection capacity and safe alternatives when provision closes.
Process illustration; no effect sizes implied. MHCLG and DWP: Supported Housing regulation: government response · 2026-06-19 · Introduction; licensing; exemptions; next steps.
Age and condition
New supply is only part of the task. Older buildings, damp and unsafe homes need sustained repairs and investment.
England · homes built before 1919 · 2016–17 → 2024
32 in every 100 homes in 2024.
3 percentage points lower than 2016–17.
20 in every 100 homes in 2024.
1 percentage point lower than 2016–17.
6 in every 100 homes in 2024.
1 percentage point lower than 2016–17.
Age alone does not mean poor condition. These snapshots show the changing mix of homes in each tenure, not the same homes followed over time.
Rounded survey shares; differences are descriptive, not tests of statistical significance. The earlier ONS release labels the period financial year ending 2017; its England analysis reports 35% private, 21% owner occupied and 7% social rented. The latest EHS dwelling survey is 2024 (32%, 20%, 6%). No annual path between snapshots is inferred. Each square is one percentage point of the 2024 stock.
ONS · UK private rented sector, England, Figure 38 and accompanying textEnglish Housing Survey · Figure 1.8, Annex Table 1.6One period, one scale: 2006–2024. Conditions improved overall, but damp has risen again in recent years.
34.9% → 15.4%
2006 → 2024 · -19.5 percentage points
4 million homes in 2024
9.8% → 5.5%
2006 → 2024 · -4.3 percentage points
1.4 million homes in 2024
Teal solid: non-decent · rust dashed: damp. Hollow dots: modelled 2020–21 estimates. Categories overlap; do not add the totals.
The current non-decent definition starts in 2006, so both chart comparisons start there. The full damp record below begins in 1996, with gaps before 2003. We retain it without using a different headline baseline. Energy-efficiency assessment methods also changed over the record. Survey estimates of dwellings. Categories overlap and must not be added. The charts use published percentages; headline dwelling counts are rounded. Pandemic estimates for 2020–21 were modelled, with a different survey basis.
English Housing Survey · Annex 1.4 and 1.9| Year | Non-decent (%) | Damp (%) | Basis |
|---|---|---|---|
| 1996 | Not comparable | 12.8 | Survey |
| 2001 | Not comparable | 9.6 | Survey |
| 2003 | Not comparable | 10.6 | Survey |
| 2004 | Not comparable | 10.4 | Survey |
| 2005 | Not comparable | 10.1 | Survey |
| 2006 | 34.9 | 9.8 | Survey |
| 2007 | 34.7 | 8.6 | Survey |
| 2008 | 33.1 | 7.8 | Survey |
| 2009 | 30.1 | 8.1 | Survey |
| 2010 | 26.5 | 6.5 | Survey |
| 2011 | 23.6 | 4.6 | Survey |
| 2012 | 21.8 | 4.3 | Survey |
| 2013 | 20.6 | 4.3 | Survey |
| 2014 | 19.8 | 4.3 | Survey |
| 2015 | 19.4 | 4.4 | Survey |
| 2016 | 19.9 | 4.2 | Survey |
| 2017 | 18.8 | 3.7 | Survey |
| 2018 | 17.8 | 3.3 | Survey |
| 2019 | 17 | 3.4 | Survey |
| 2020 | 15 | 4 | Modelled |
| 2021 | 14.3 | 3.8 | Modelled |
| 2022 | 14.7 | 4.1 | Survey |
| 2023 | 15 | 5.2 | Survey |
| 2024 | 15.4 | 5.5 | Survey |
Building safety also matters: unsafe-cladding remediation and other housing weaknesses →
Availability
Credit can help someone compete for a home. It cannot by itself create one. Supply, location and tenure determine the choices available.
Net additions include conversions and changes of use, less demolitions. Latest year provisional. This is not the number currently for sale.
Live Table 118, England total, 2000–01 onwards. Includes Census adjustments; the component collection begins in 2006–07. Earlier figures are less reliable. Financial years are plotted at their starting year.
MHCLG · Live Table 118 (ODS)| Year | Net homes | Status |
|---|---|---|
| 2000–01 | 132,000 | Published estimate |
| 2001–02 | 146,704 | Published estimate |
| 2002–03 | 159,875 | Published estimate |
| 2003–04 | 170,969 | Published estimate |
| 2004–05 | 185,553 | Published estimate |
| 2005–06 | 202,653 | Published estimate |
| 2006–07 | 214,936 | Published estimate |
| 2007–08 | 223,534 | Published estimate |
| 2008–09 | 182,767 | Published estimate |
| 2009–10 | 144,870 | Published estimate |
| 2010–11 | 137,394 | Published estimate |
| 2011–12 | 140,785 | Published estimate |
| 2012–13 | 130,611 | Published estimate |
| 2013–14 | 142,494 | Published estimate |
| 2014–15 | 176,582 | Published estimate |
| 2015–16 | 195,534 | Published estimate |
| 2016–17 | 223,234 | Published estimate |
| 2017–18 | 228,170 | Published estimate |
| 2018–19 | 247,766 | Published estimate |
| 2019–20 | 248,591 | Published estimate |
| 2020–21 | 217,754 | Published estimate |
| 2021–22 | 234,462 | Published estimate |
| 2022–23 | 234,292 | Published estimate |
| 2023–24 | 221,409 | Published estimate |
| 2024–25 | 208,600 | Provisional |
177,530 children were in council-arranged temporary accommodation in March 2026. The household trend below counts their families, not additional people.
Households placed in temporary accommodation by councils under homelessness duties, at the end of each quarter. It does not count people sleeping rough, sofa-surfing, or not known to a council. The Homelessness Reduction Act 2017 (in force April 2018) changed the duties under which people are placed.
Source dataset →| Period | households | Status |
|---|---|---|
| Mar 1998 | 47,520 | Outturn |
| Jun 1998 | 49,390 | Outturn |
| Sep 1998 | 52,510 | Outturn |
| Dec 1998 | 53,790 | Outturn |
| Mar 1999 | 56,580 | Outturn |
| Jun 1999 | 58,430 | Outturn |
| Sep 1999 | 61,450 | Outturn |
| Dec 1999 | 62,180 | Outturn |
| Mar 2000 | 65,170 | Outturn |
| Jun 2000 | 67,520 | Outturn |
| Sep 2000 | 71,860 | Outturn |
| Dec 2000 | 73,080 | Outturn |
| Mar 2001 | 75,200 | Outturn |
| Jun 2001 | 75,920 | Outturn |
| Sep 2001 | 77,800 | Outturn |
| Dec 2001 | 77,510 | Outturn |
| Mar 2002 | 80,200 | Outturn |
| Jun 2002 | 81,660 | Outturn |
| Sep 2002 | 85,010 | Outturn |
| Dec 2002 | 85,140 | Outturn |
| Mar 2003 | 89,040 | Outturn |
| Jun 2003 | 91,870 | Outturn |
| Sep 2003 | 94,440 | Outturn |
| Dec 2003 | 94,610 | Outturn |
| Mar 2004 | 97,680 | Outturn |
| Jun 2004 | 99,530 | Outturn |
| Sep 2004 | 101,300 | Outturn |
| Dec 2004 | 101,030 | Outturn |
| Mar 2005 | 101,070 | Outturn |
| Jun 2005 | 100,970 | Outturn |
| Sep 2005 | 101,020 | Outturn |
| Dec 2005 | 98,730 | Outturn |
| Mar 2006 | 96,370 | Outturn |
| Jun 2006 | 93,910 | Outturn |
| Sep 2006 | 93,090 | Outturn |
| Dec 2006 | 89,510 | Outturn |
| Mar 2007 | 87,120 | Outturn |
| Jun 2007 | 84,900 | Outturn |
| Sep 2007 | 82,750 | Outturn |
| Dec 2007 | 79,500 | Outturn |
| Mar 2008 | 77,510 | Outturn |
| Jun 2008 | 74,690 | Outturn |
| Sep 2008 | 72,130 | Outturn |
| Dec 2008 | 67,480 | Outturn |
| Mar 2009 | 64,000 | Outturn |
| Jun 2009 | 60,230 | Outturn |
| Sep 2009 | 56,920 | Outturn |
| Dec 2009 | 53,370 | Outturn |
| Mar 2010 | 51,310 | Outturn |
| Jun 2010 | 50,400 | Outturn |
| Sep 2010 | 49,680 | Outturn |
| Dec 2010 | 48,010 | Outturn |
| Mar 2011 | 48,240 | Outturn |
| Jun 2011 | 48,330 | Outturn |
| Sep 2011 | 49,100 | Outturn |
| Dec 2011 | 48,920 | Outturn |
| Mar 2012 | 50,430 | Outturn |
| Jun 2012 | 51,630 | Outturn |
| Sep 2012 | 52,960 | Outturn |
| Dec 2012 | 53,140 | Outturn |
| Mar 2013 | 55,320 | Outturn |
| Jun 2013 | 55,840 | Outturn |
| Sep 2013 | 57,410 | Outturn |
| Dec 2013 | 56,940 | Outturn |
| Mar 2014 | 58,410 | Outturn |
| Jun 2014 | 59,570 | Outturn |
| Sep 2014 | 60,900 | Outturn |
| Dec 2014 | 61,930 | Outturn |
| Mar 2015 | 64,710 | Outturn |
| Jun 2015 | 66,980 | Outturn |
| Sep 2015 | 68,560 | Outturn |
| Dec 2015 | 69,140 | Outturn |
| Mar 2016 | 71,670 | Outturn |
| Jun 2016 | 73,050 | Outturn |
| Sep 2016 | 74,750 | Outturn |
| Dec 2016 | 75,740 | Outturn |
| Mar 2017 | 77,220 | Outturn |
| Jun 2017 | 78,540 | Outturn |
| Sep 2017 | 79,830 | Outturn |
| Dec 2017 | 79,720 | Outturn |
| Mar 2018 | 80,720 | Outturn |
| Jun 2018 | 82,390 | Outturn |
| Sep 2018 | 83,430 | Outturn |
| Dec 2018 | 83,540 | Outturn |
| Mar 2019 | 85,040 | Outturn |
| Jun 2019 | 86,240 | Outturn |
| Sep 2019 | 87,390 | Outturn |
| Dec 2019 | 88,310 | Outturn |
| Mar 2020 | 92,190 | Outturn |
| Jun 2020 | 98,260 | Outturn |
| Sep 2020 | 94,610 | Outturn |
| Dec 2020 | 95,100 | Outturn |
| Mar 2021 | 95,290 | Outturn |
| Jun 2021 | 95,850 | Outturn |
| Sep 2021 | 95,560 | Outturn |
| Dec 2021 | 96,280 | Outturn |
| Mar 2022 | 95,000 | Outturn |
| Jun 2022 | 95,690 | Outturn |
| Sep 2022 | 98,840 | Outturn |
| Dec 2022 | 100,510 | Outturn |
| Mar 2023 | 104,540 | Outturn |
| Jun 2023 | 105,840 | Outturn |
| Sep 2023 | 108,920 | Outturn |
| Dec 2023 | 112,610 | Outturn |
| Mar 2024 | 117,350 | Outturn |
| Jun 2024 | 123,030 | Outturn |
| Sep 2024 | 125,970 | Outturn |
| Dec 2024 | 127,820 | Outturn |
| Mar 2025 | 130,890 | Outturn |
| Jun 2025 | 132,340 | Outturn |
| Sep 2025 | 134,700 | Outturn |
| Dec 2025 | 134,140 | Outturn |
| Mar 2026 | 135,580 | Outturn |
Private renting
Rent is an ongoing household cost. The size of the rented sector shows how many people rely on it; it does not tell us whether a suitable home is available locally.
Mean private rent (all tenancies, new and existing) as a share of the median GROSS monthly income of private-renting households (Family Resources Survey). Not take-home pay, and not an individual worker. ONS treats 30% or less as affordable. Regional estimates rest on survey samples and can move a lot year to year. ONS warns these estimates are not directly comparable with earlier editions of the release (method changed in 2024).
Source dataset →| Period | % | Status |
|---|---|---|
| 2015-16 | 39.4 | Outturn |
| 2016-17 | 39.2 | Outturn |
| 2017-18 | 39 | Outturn |
| 2018-19 | 37 | Outturn |
| 2019-20 | 35.4 | Outturn |
| 2020-21 | 38 | Outturn |
| 2021-22 | 35.7 | Outturn |
| 2022-23 | 33.1 | Outturn |
| 2023-24 | 36.3 | Outturn |
English Housing Survey and its predecessors. Before 2008 figures come from the Labour Force Survey and earlier household surveys; years with no survey are left blank, not filled. Source changes: 1980–1991 DoE estimates; 1992–2008 Labour Force Survey; 2008-09 onward English Housing Survey.
Source dataset →| Period | % | Status |
|---|---|---|
| 1996 | 10.1 | Outturn |
| 1997 | 10.5 | Outturn |
| 1998 | 10.3 | Outturn |
| 1999 | 9.9 | Outturn |
| 2000 | 10 | Outturn |
| 2001 | 10.1 | Outturn |
| 2002 | 10.3 | Outturn |
| 2003 | 10.8 | Outturn |
| 2004 | 11 | Outturn |
| 2005 | 11.7 | Outturn |
| 2006 | 12.2 | Outturn |
| 2007 | 12.7 | Outturn |
| 2008 | 13.9 | Outturn |
| 2008-09 | 14.2 | Outturn |
| 2009-10 | 15.6 | Outturn |
| 2010-11 | 16.5 | Outturn |
| 2011-12 | 17.4 | Outturn |
| 2012-13 | 18 | Outturn |
| 2013-14 | 19.4 | Outturn |
| 2014-15 | 19 | Outturn |
| 2015-16 | 19.9 | Outturn |
| 2016-17 | 20.3 | Outturn |
| 2017-18 | 19.5 | Outturn |
| 2018-19 | 19.3 | Outturn |
| 2019-20 | 18.7 | Outturn |
| 2020-21 | 18.5 | Outturn |
| 2021-22 | 19.1 | Outturn |
| 2022-23 | 18.8 | Outturn |
| 2023-24 | 18.8 | Outturn |
| 2024-25 | 18.9 | Outturn |
The 2024 dwelling survey estimated 11% of private rented homes were vacant. Empty does not necessarily mean available or suitable to let.
Vacancy definition and source →The same regions, two measures: purchase price ÷ individual annual pay; rent ÷ gross household income. The rent chart is not a comparison with monthly mortgage payments.
Buying affordability
English regions · 2025 versus 2007
Source: ONS, Housing affordability in England and Wales: 2025, dataset Table 1c (released 26 March 2026).
| Region | 2025 | 2007 |
|---|---|---|
| London | 10.61 | 7.94 |
| South East | 9.58 | 8.40 |
| East of England | 9.02 | 7.77 |
| South West | 8.33 | 8.29 |
| East Midlands | 7.02 | 6.43 |
| West Midlands | 6.80 | 6.48 |
| Yorkshire and The Humber | 6.03 | 6.04 |
| North West | 5.92 | 5.83 |
| North East | 5.00 | 5.79 |
Rental affordability
English regions · 2023–24 versus 2015–16
Source: ONS, Private rental affordability, England, Wales and Northern Ireland: 2024, dataset Table 3.
| Area | 2023–24 | 2015–16 |
|---|---|---|
| London | 41.6% | 52.0% |
| England | 36.3% | 39.4% |
| South West | 31.4% | 32.1% |
| South East | 29.6% | 33.2% |
| West Midlands | 29.2% | 27.2% |
| East of England | 28.9% | 33.1% |
| North West | 28.1% | 30.2% |
| Yorkshire and The Humber | 27.4% | 26.3% |
| Wales | 25.9% | 31.5% |
| East Midlands | 24.4% | 25.0% |
| North East | 19.8% | 28.0% |
The accommodation survey release needs review before its values can be displayed. Read the original source.
Proposals to consider. The bodies named below would need to agree to deliver them; responsibility is not a recorded commitment. Follow the links for costs and evidence.
Focus on getting homes built after planning permission is granted.
Who could deliver it: Planning authorities, housing bodies, developers and utilities; devolved responsibility.
Binding construction/infrastructure constraints; environmental and displacement harms.
Select sites; resolve land, planning, utilities, transport and viability; commission tenure mix and delivery agreements.
Cost: The extra cost is not yet known.
Costs, drawbacks and evidence →Use social-housing funding to provide settled homes for families in temporary accommodation.
Who could deliver it: Councils and housing providers; relevant national housing bodies.
Competition with other buyers; displacement; unsuitable location/condition.
Define families and locations; compare acquisition, lease and new build; inspect standards; secure lettings and tenancy support.
Cost: Only part of the cost has been estimated.
Costs, drawbacks and evidence →Test whether early help with rent arrears and legal advice prevents people losing their homes.
Who could deliver it: councils, housing/advice providers and landlords.
The main risks still need to be assessed.
Define arrears/risk trigger, legal advice and assistance design; cost staff, grants and sustained tenancies. Assess additional prevention against existing duties. Proposed owners: councils, housing/advice providers and landlords.
Cost: The extra cost is not yet known.
Costs, drawbacks and evidence →Protect existing flood defences and judge new schemes against the risk to local homes and businesses.
Who could deliver it: Defra, Environment Agency and local partners in England..
Residual risk, false assurance and displacement of water or spending to other places.
List safety/maintenance gaps, cost them and appraise new schemes using expected damage and distribution. Use engineering and risk appraisal; low trial evidence is not grounds to leave essential protection unmanaged.
Cost: Only part of the cost has been estimated.
Costs, drawbacks and evidence →See all options and what is still unknown →
Some problems have no assessed solution yet: see coverage and gaps.
These links can help with an individual situation. They do not resolve the wider pressures described above.
GOV.UK guidance covers tenancy types, repairs, deposits and complaints. Use the guidance that applies to your tenancy and nation.
The official guide explains how to contact a council for help and links to the arrangements in Scotland, Wales and Northern Ireland.
Recorded
Budget 2026 bears on 4 of these findings
A ten-year, £39bn Social and Affordable Homes Programme aims for around 300,000 homes with at least 60% for social rent; the first £9.58bn went to 33 strategic partners outside London on 25 August 2026, with more than £16bn outside London and around £5bn in London still to allocate.
England · 2026–27 to 2035–36
The planning reforms are in force: the National Planning Policy Framework was revised in December 2024 and replaced by a new version on 17 August 2026, and the Planning and Infrastructure Act 2025 became law on 18 December 2025. Their effect on the number of homes built has not yet been observed.
England · December 2024 to August 2026
Land capacity is not completed housing. The NAO found gaps in tracking homes built through some land-unlocking funds and called for long-term monitoring across programmes. Funding allocations and an unlocked site cannot establish how many suitable homes people can occupy.
England · February 2026 audit · risk
Supported housing is more than a bed. Residents may need help to live independently; weak oversight can leave them paying for support they do not receive. The June 2026 government response sets out licensing and support standards. These are implementation proposals, not evidence that poor provision has already been eliminated. Councils need inspection capacity and safe alternatives when provision closes.
England; Housing Benefit changes also concern Scotland and Wales · 2026-06-19 · risk
Budget 2026 responds to this
Funding for a licensing regime to enforce national standards from 2027–28.
The FCA found misleading promotions and unsuitable advice in later-life mortgage sales, including inadequate consideration of alternatives and incentives that could favour sales. Its intervention led reviewed firms to change their processes. Rolling up interest can substantially increase lifetime-mortgage debt; suitability and clear total-cost explanations remain important.
United Kingdom · FCA review, September 2023
Mean private rent was 36.3% of median gross renter-household income, and 41.6% in London. This is a ratio of averages, not every household’s rent burden; the England share has not risen steadily.
England · 2023-24
Of 4,724 monitored residential buildings at least 11 metres high with unsafe cladding, 2,153 had not started remediation. This monitored portfolio is not a count of every unsafe home; coverage changes over time.
England · August 2026
4 million dwellings (15%) did not meet the Decent Homes Standard; 1.4 million (5%) had damp. Existing-home condition needs attention alongside supply and affordability. The categories overlap.
England · 2024
A typical home costs 7.6 times full-time annual earnings, against 3.5 in 1997 (the early earnings basis differs in 1997–98).
England · 2025 (1997 reference)
135,580 households, including 177,530 children, were in temporary accommodation.
England · March 2026
Budget 2026 responds to this
New money for rough sleeping and around 10,000 social and affordable homes; whether it reduces temporary accommodation depends on who the homes are let to.
Rough SleepingSocial and Affordable Homes ProgrammeTrack delivery →
England added 208,600 homes, against about 300,000 a year implied by the government’s 1.5 million ambition.
England · 2024–25
Prevention works for just over half of households: of 35,130 prevention duties that ended in January–March 2026, 54.7% ended with a home secured for six months or more and 25% became homeless. The end of a private tenancy was the most common reason among the 39,200 households owed a duty (36.0%).
England · January to March 2026
Pairing deliverable sites with the new social-rent programme could turn grant into lettings for households in temporary accommodation.
Depends on: Named awards go to additional homes on sites whose infrastructure is funded, and councils can let them to homeless households.
our synthesis
Budget 2026 responds to this
A top-up to the social and affordable homes programme and a zero VAT rate on land sold for social housing.
Social and Affordable Homes ProgrammeSocial HousingTrack delivery →
The OBR estimated in March 2025 that the December 2024 changes to the National Planning Policy Framework would add about 170,000 homes over five years. The estimate was made before the Planning and Infrastructure Act 2025 and is not an estimate of that Act.
Depends on: Councils apply the revised framework and the permitted homes are built. The OBR calls its own judgement uncertain, and in March 2026 said the effect had “yet to meaningfully materialise in outturn”.
United Kingdom · March 2025 forecast, for 2025–26 to 2029–30 · modelled estimate
Lower deposits and easier lending can widen access but leave borrowers with less equity and more exposure to income, rate and house-price shocks. Your First Home was announced in September 2026; its final terms, public cost and additional supply effects are not yet established. Responsible-lending safeguards remain essential.
United Kingdom; Your First Home is England only · 2026 · risk
Budget 2026 responds to this
The Budget published Your First Home’s terms (2.5% minimum deposit, 20% equity loan) and £4.7bn of funding; its effect on supply and on borrowers’ risk is still unestablished.
Build-cost inflation, shortages of materials and labour, stretched planning teams and delays with utilities can mean fewer completions than planned — as the NAO found for the last programme.
risk
About 6.3 million properties in England are in areas at risk of flooding from rivers, the sea or surface water; with climate change the Environment Agency projects around 8 million — 1 in 4 properties — by mid-century.
England · 2024 assessment; projection to mid-century · risk
Proposed
Possible steps for government and the bodies responsible. These describe the order of work, not promised dates: starting an action and seeing results take different amounts of time.
Short term · prepare
Identify sites held up by land, planning or utility connections.
Medium term · deliver
Resolve those obstacles and secure builders, funding and affordable homes.
Long term · judge results
Judge success by completed homes and whether people can afford them.
Homes still cost nearly eight years of full-time pay.
In England a median home cost 7.6× median gross full-time annual earnings in 2025, against 9.1× at the 2021 peak and 4.2× in 2000. A price-to-earnings ratio, not a deposit or mortgage measure. Three separate observations, not a continuous line.
A ratio of price to pay — not a mortgage payment or deposit measure. Local ratios vary far more widely.
Homes still cost nearly eight years of full-time pay. In England a median home cost 7.6× median gross full-time annual earnings in 2025, against 9.1× at the 2021 peak and 4.2× in 2000. A price-to-earnings ratio, not a deposit or mortgage measure. Three separate observations, not a continuous line.
| Measure | Value | Period | Geography | Type | Source |
|---|---|---|---|---|---|
| House price to workplace-based earnings ratio, England, 1997 | 3.5× | 1997 | England | observed count | Office for National Statistics, Housing affordability in England and Wales |
| House price to workplace-based earnings ratio, England, 2000 | 4.2× | 2000 | England | observed count | Office for National Statistics, Housing affordability in England and Wales |
| House price to workplace-based earnings ratio, England, 2021 | 9.1× | 2021 | England | observed count | Office for National Statistics, Housing affordability in England and Wales |
| House price to workplace-based earnings ratio, England, 2025 | 7.6× | 2025 | England | observed count | Office for National Statistics, Housing affordability in England and Wales |
Image description: Housing infographic: a typical home in England cost 7.6 times full-time annual pay in 2025, against 3.5 in 1997 and 9.1 in 2021.
A landscape card for sharing this finding. Post it with the page link — an uploaded image does not link back by itself.
Available images and their source records are listed on Shareable visuals.

Social housing
Lower rents need homes people can actually access
Social rent offers a different route to a settled home. Increasing that supply matters alongside helping buyers.
Council rents: lower costs, limited access
Councils and housing associations both provide social housing. “Council” describes the landlord; Social Rent and Affordable Rent describe how the rent is set. Access depends on eligibility, allocation and homes becoming available.
Council rent: source and definition
Pages 11 and 14; England general-needs Social Rent, excluding service charges. 2024 derived from £107.88 less published £8.13 change. Stock revisions were not applied to earlier rents. These stock-wide net rents differ from the new-letting geometric means below; they are not a matched-home comparison.
Regulator of Social Housing · 2024–25 stock and rentsCouncil Social Rent · England
£107.88 / week
Average general-needs net rent
31 March 2025 · service charges extra
£99.75 in 2024 → £107.88
Social-rent additions remain below the 1990s
12,267 added in 2024–25. These are gross additions: sales and demolitions also affect the stock.
Sources, definitions and data
Live Table 1000, revised 25 June 2026. Social Rent excludes Affordable Rent and shared ownership. Some London grant reporting cannot separate social rent from London Affordable Rent; see source notes. Financial years are plotted at their starting year.
MHCLG · Live Table 1000Two rent labels, different costs
England · average weekly rent for new social-sector lettings, 2024–25
Social Rent£113 / week
Affordable Rent£160 / week
“Affordable Rent” is a policy category, not a promise that every household can afford it. These rents describe new lettings, not every existing tenancy.
Sources, definitions and data
MHCLG CORE lettings statistics, geometric means across new lets (general needs and supported housing), section 7.2. Differences also reflect where homes are and their size; this is not a matched-property comparison.
Social housing lettings · rents