Operational
Meet today’s commitments
People, equipment and support available for a defined task, at the required notice.
Headline evidence · Defence · United Kingdom · spending 2010–11 to 2024–25 · personnel 2010 to 1 July 2026
Britain's regular forces are 28% smaller than in 2010, while real defence spending is 5% higher. Fewer people for similar money is not a verdict on capability. Whether the forces could fight and sustain a major conflict is not published.
Proposed outcome: Keep the Armed Forces ready and able to sustain operations against the threats Britain faces. What could change →
How much smaller are the regular forces than in 2010?
28% smaller
There are about 138,000 regular service personnel, down from about 192,000 in 2010. Real defence spending over the same years is about 5% higher. This counts people, not how ready or capable the forces are.
United Kingdom · 1 April 2010 and 2026 · Published statistics
137,966 UK regular service personnel on 1 April 2026, against 191,710 on 1 April 2010. Excludes Gurkhas and reserves. The Army is 32% smaller and the Royal Air Force 29% smaller. Real defence spending over the same years is 5% higher (£57.1bn in 2010–11 to £60.2bn in 2024–25, 2024–25 prices). The latest quarterly count is 137,482 (1 July 2026). This is a count of people, not a measure of readiness or of NATO capability targets, which are classified.
Published statistics · MOD, Quarterly Service Personnel Statistics 1 July 2026 (Table 1); UK Defence Statistics 2012 (Table 2.5), Table 1 (2026); Table 2.5 of UK Defence Statistics 2012 (2010)
Are major equipment programmes on track?
16 of 39rated Red
Equipment programmes facing serious delivery risk. A red rating does not mean a programme has already failed.
United Kingdom · as at 31 March 2026
MOD major projects rated Red (41%), against 14% elsewhere in government. 5 MOD ratings are withheld. Red means delivery is at serious risk, not that a programme has failed.
Published statistics · NISTA, Major Projects Annual Report 2025-26
Has defence spending recovered since 2010–11, after inflation?
£60.2bnafter inflation
Spending after allowing for inflation. More money does not by itself show that equipment, staff or ammunition are ready.
United Kingdom · 2010–11 and 2024–25
2024–25, against £57.1bn in 2010–11 — both in 2024–25 prices. Low of £46.2bn in 2016–17. Planned to reach £79.1bn (cash, a different basis) in 2029–30. Spending is an input, not a readiness measure.
Published statistics · MOD, Defence Departmental Resources 2025 (Worksheet 1: Defence Expenditure Outturn)
Readiness depends on the task, the notice required and how long forces must sustain it. The public record shows investment, personnel and delivery risks, with important gaps. More resources can help, but equipment, training, support and industrial capacity take time to deliver.
Budget 2026 · 28 October 2026
5
Budget measures on this topic
£2.1bn
Net cost, 2026–27
£300m
Net saving or gain, 2029–30
Biggest single-year effect of each measure · red costs money, teal saves or raises it
+£2.1bn
saving or gain in 2027–28
Defence Investment Plan
−£1.8bn
cost in 2026–27
Defence Investment Plan (DIP)
−£500m
cost in 2026–27
Ukraine
+£200m
saving or gain in 2027–28
UK Export Finance
−£95m
cost in 2029–30
Defence
Treasury costings certified by the OBR, not measured results. Topic links are UK Facts’ classification.
The regular forces are about 30% smaller than in 2006. Money has not fallen: in real terms the defence budget is about 12% higher. Part of the answer is that equipment, pensions, nuclear and support now take a larger share of each pound than they did. Part is by design, with technology doing some of what people did. This page does not claim that fewer people means weaker forces, or that more money means stronger ones; it shows that the two have moved apart.
29.6% fewer in 20 years. UK Regular Forces, trained and untrained, excluding Gurkhas and reserves, at 1 April.
Percentage fall in regular strength, 2006 to 2026.
MOD “Defence Spending”, 2024-25 prices. The money is not lower; the number of people is.
Core defence spending as a share of GDP. 2025 and 2026 are estimates. NATO’s pledge is 3.5% by 2035.
Counts are not readiness. MOD says 'in service' varies by equipment type and is not an availability rate.
No official figure says how ready the forces are to fight. The Strategic Defence Review recommended publishing availability data each year and a Defence Readiness Bill; the Bill had not been introduced when this was checked. NATO’s capability targets for each country are classified, so no public source can say whether the UK’s smaller forces meet its obligations. What is public is that the pledge on spending is 3.5% of national income by 2035; the UK is at about 2.3% to 2.6% now.
Most defence money stays in the UK: 85% of the £38bn spent with industry in 2024–25 was for work done here. About 15% was for work done overseas, and about 6% went to the US government, mainly for F-35 jets and the Trident missile. The £38bn is a different measure from total defence spending, so these shares are not shares of the £60bn budget. The MOD does not publish equipment bought from US companies as a figure. The 'location of work' basis counts a UK-based foreign-owned supplier as UK. The F-35 and Trident split of the US Government payments is not published.
15% of the spending was for work done overseas, down from 19% in 2020-21. North America was 6.9%.
Direct payments to the US government (Foreign Military Sales £623m, other US government payments £1731m, mainly F-35 and Trident) total £2,354m, 6.2% of the total.
For several items there is no UK-built alternative today. Where there is, UK-built does not mean on time: Challenger 3 and Ajax are rated Red. No source we found gives the price difference between a UK-built and an imported version, so none is shown. These are not costed.
| Bought abroad | What a UK route involves | Caveat | Cost |
|---|---|---|---|
| F-35 fighter jets (US) | No UK-built stealth fighter exists. The UK route is the GCAP fighter with Italy and Japan; the Defence Investment Plan puts £8.6bn into it for 2026-30. | The F-35 is in service to 2069. The National Audit Office puts its whole-life cost at £71bn. | Not costed as a switch |
| P-8 Poseidon, Apache, Chinook (US) | No UK alternative identified. Plan funds sustainment and upgrades; the Stingray torpedo is restarted in the UK. | Foreign Military Sales were £623m in 2024-25. | Not costed as a switch |
| Missiles and ammunition | Plan: £11.1bn for 2026-30, at least six energetics factories by 2030, and 'always on' orders for UK-made missiles. | Some is cooperative with Germany, France and Italy. | £11.1bn in the plan |
| Army vehicles | Already built or rebuilt in the UK: Challenger 3, Ajax, Boxer. | These are rated Red or Amber for delivery: buying British does not by itself deliver on time or cost. | As stated per programme |
| Offsets | The Defence Industrial Strategy proposes requiring UK jobs and technology in return when the UK buys abroad, subject to consultation. | Not in force. | Not costed |
Sources: MOD regional expenditure with industry 2024/25; Defence Investment Plan (June 2026); National Audit Office, The UK’s F-35 capability (July 2025); Defence Industrial Strategy 2025.
Concern about international conflict does not measure public support for a particular defence policy or the Armed Forces’ readiness.
The question behind the numbers
Operational
People, equipment and support available for a defined task, at the required notice.
Warfighting
Sustain high-intensity operations, replace losses and replenish supplies over time.
Strategic
Government, industry, infrastructure, reserves and society supporting the effort.
These are different questions. Spending, headcount and project ratings help explain the resources and delivery risks. They cannot establish an overall readiness percentage. Missing public information is an uncertainty, not proof of failure. Defence Committee framework, February 2024.
Defence Investment Plan · 30 June 2026. These are policy commitments; this diagram does not disclose operational plans.
Government commitments
Spending plans are promises. Delivery means equipment arrives, works and has trained people to use and maintain it.
MOD and HM Treasury · 30 June 2026
Military leadership
Air Chief Marshal Sir Richard Knighton argued for industrial capacity, skills and wider national resilience as well as stronger forces. This is his published assessment, not a measured readiness return or a claim that all commanders agree.
Chief of the Defence Staff, RUSI speech · 15 December 2025
Serving personnel
The survey asks trained regular personnel about service life. Their experiences help explain why people may leave, but do not measure readiness to fight.
MOD, Armed Forces Continuous Attitude Survey · 28 May 2026
Independent scrutiny
The NAO’s F-35 audit recognised operational capability while finding delivery, staffing and support gaps against the intended programme. Its conclusions are specific to that programme and date.
National Audit Office · 11 July 2025
UK regular forces · people · annual figures
| Period ending | Intake | Outflow | Net |
|---|---|---|---|
| 2013-03-31 | 14,370 | 23,531 | -9,161 |
| 2014-03-31 | 11,885 | 23,013 | -11,128 |
| 2015-03-31 | 12,980 | 18,912 | -5,932 |
| 2016-03-31 | 13,796 | 16,545 | -2,749 |
| 2017-03-31 | 13,383 | 15,047 | -1,664 |
| 2018-03-31 | 12,359 | 15,172 | -2,813 |
| 2019-03-31 | 12,485 | 14,633 | -2,148 |
| 2020-03-31 | 16,344 | 15,455 | 889 |
| 2021-03-31 | 16,245 | 12,299 | 3,946 |
| 2022-03-31 | 13,351 | 14,633 | -1,282 |
| 2023-03-31 | 11,088 | 16,511 | -5,423 |
| 2024-03-31 | 11,298 | 15,729 | -4,431 |
| 2025-03-31 | 13,452 | 14,587 | -1,135 |
| 2026-03-31 | 14,370 | 13,393 | 977 |
2026-07-01
Ministry of Defence: Quarterly Service Personnel Statistics: 2026 · period 2026-07-01 · released 23 September 2026 · last successful refresh 10 October 2026 · Within refresh window. Official data download.
AFCAS 2026 · weighted percentages · different questions and bases
Published margin ±1.8 percentage points · responding base 7,459
Published margin ±1.7 percentage points · responding base 7,600
Published margin ±1.8 percentage points · responding base 7,470
Published margin ±1.9 percentage points · responding base 6,714
Published margin ±3.4 percentage points · responding base 1,900
Published margins are retained rather than inventing confidence intervals. MOD flags comparisons at the 99% significance level. Sampling excludes deployed personnel and those on training courses. Quality report.
| Year | Satisfied (%) | Margin (pp) | Base |
|---|---|---|---|
| 2007 | 47 | 2.0 | Not supplied |
| 2008 | 51 | 1.6 | Not supplied |
| 2009 | 61 | 1.8 | Not supplied |
| 2010 | 60 | 1.4 | Not supplied |
| 2011 | 57 | 1.4 | Not supplied |
| 2012 | 51 | 1.8 | Not supplied |
| 2013 | 49 | 1.9 | Not supplied |
| 2014 | 48 | 1.5 | Not supplied |
| 2015 | 47 | 1.8 | Not supplied |
| 2016 | 46 | 1.4 | Not supplied |
| 2017 | 42 | 1.5 | Not supplied |
| 2018 | 41 | 1.6 | Not supplied |
| 2019 | 46 | 1.6 | Not supplied |
| 2020 | 45 | 1.7 | Not supplied |
| 2021 | 50 | 1.6 | Not supplied |
| 2022 | 45 | 1.9 | Not supplied |
| 2023 | 42 | 1.8 | Not supplied |
| 2024 | 40 | 1.7 | Not supplied |
| 2025 | 42 | 1.7 | Not supplied |
| 2026 | 45 | 1.8 | 7,459 |
| Year | Satisfied (%) | Margin (pp) | Base |
|---|---|---|---|
| 2007 | 40 | 1.8 | Not supplied |
| 2008 | 41 | 1.5 | Not supplied |
| 2009 | 50 | 1.8 | Not supplied |
| 2010 | 52 | 1.4 | Not supplied |
| 2011 | 43 | 1.4 | Not supplied |
| 2012 | 40 | 1.7 | Not supplied |
| 2013 | 39 | 1.8 | Not supplied |
| 2014 | 39 | 1.4 | Not supplied |
| 2015 | 36 | 1.7 | Not supplied |
| 2016 | 35 | 1.3 | Not supplied |
| 2017 | 33 | 1.4 | Not supplied |
| 2018 | 31 | 1.5 | Not supplied |
| 2019 | 35 | 1.5 | Not supplied |
| 2020 | 39 | 1.7 | Not supplied |
| 2021 | 45 | 1.5 | Not supplied |
| 2022 | 40 | 1.8 | Not supplied |
| 2023 | 31 | 1.6 | Not supplied |
| 2024 | 32 | 1.6 | Not supplied |
| 2025 | 34 | 1.6 | Not supplied |
| 2026 | 37 | 1.7 | 7,600 |
| Year | Low (%) | Margin (pp) | Base |
|---|---|---|---|
| 2007 | 63 | 2.0 | Not supplied |
| 2008 | 55 | 1.6 | Not supplied |
| 2009 | 38 | 1.8 | Not supplied |
| 2010 | 33 | 1.3 | Not supplied |
| 2011 | 44 | 1.4 | Not supplied |
| 2012 | 50 | 1.7 | Not supplied |
| 2013 | 55 | 1.9 | Not supplied |
| 2014 | 52 | 1.5 | Not supplied |
| 2015 | 49 | 1.7 | Not supplied |
| 2016 | 52 | 1.4 | Not supplied |
| 2017 | 61 | 1.5 | Not supplied |
| 2018 | 67 | 1.6 | Not supplied |
| 2019 | 60 | 1.6 | Not supplied |
| 2020 | 53 | 1.8 | Not supplied |
| 2021 | 42 | 1.5 | Not supplied |
| 2022 | 45 | 1.9 | Not supplied |
| 2023 | 50 | 1.7 | Not supplied |
| 2024 | 58 | 1.7 | Not supplied |
| 2025 | 59 | 1.7 | Not supplied |
| 2026 | 55 | 1.8 | 7,470 |
| Year | Increases my intentions to leave (%) | Margin (pp) | Base |
|---|---|---|---|
| 2007 | 62 | 2.0 | Not supplied |
| 2008 | 60 | 1.6 | Not supplied |
| 2009 | 54 | 1.8 | Not supplied |
| 2010 | 54 | 1.5 | Not supplied |
| 2011 | 53 | 1.5 | Not supplied |
| 2012 | 55 | 1.8 | Not supplied |
| 2013 | 58 | 2.0 | Not supplied |
| 2014 | 59 | 1.6 | Not supplied |
| 2015 | 61 | 1.8 | Not supplied |
| 2016 | 61 | 1.4 | Not supplied |
| 2017 | 62 | 1.5 | Not supplied |
| 2018 | 64 | 1.7 | Not supplied |
| 2019 | 62 | 1.6 | Not supplied |
| 2020 | 62 | 1.8 | Not supplied |
| 2021 | 57 | 1.6 | Not supplied |
| 2022 | 59 | 1.9 | Not supplied |
| 2023 | 63 | 1.8 | Not supplied |
| 2024 | 62 | 1.8 | Not supplied |
| 2025 | 64 | 1.8 | Not supplied |
| 2026 | 60 | 1.9 | 6,714 |
| Year | Satisfied (%) | Margin (pp) | Base |
|---|---|---|---|
| 2007 | Not available | Not available | Not supplied |
| 2008 | Not available | Not available | Not supplied |
| 2009 | Not available | Not available | Not supplied |
| 2010 | Not available | Not available | Not supplied |
| 2011 | Not available | Not available | Not supplied |
| 2012 | 46 | 3.3 | Not supplied |
| 2013 | 46 | 3.4 | Not supplied |
| 2014 | 46 | 2.8 | Not supplied |
| 2015 | 42 | 3.0 | Not supplied |
| 2016 | 32 | 2.5 | Not supplied |
| 2017 | 28 | 2.8 | Not supplied |
| 2018 | 29 | 2.9 | Not supplied |
| 2019 | 33 | 2.7 | Not supplied |
| 2020 | 37 | 3.3 | Not supplied |
| 2021 | 38 | 2.9 | Not supplied |
| 2022 | 32 | 3.3 | Not supplied |
| 2023 | 19 | 2.6 | Not supplied |
| 2024 | 28 | 3.2 | Not supplied |
| 2025 | 34 | 3.1 | Not supplied |
| 2026 | 39 | 3.4 | 1,900 |
2026
Ministry of Defence: Armed Forces Continuous Attitude Survey: 2026 · period 2026 · released 28 May 2026 · last successful refresh 10 October 2026 · Within refresh window. Official data download.
Trained strength records completion of the relevant training definition. It does not tell us whether every person is medically fit, available or part of a deployable unit. Explore strength, training and workforce plans →
The 2000 parliamentary table rounds to 100 people; UK Defence Statistics 2012 rounds to 10; the current quarterly source gives unrounded counts. Separate columns preserve these versions, including their overlap differences. These archives do not supply verified 2001–2005 figures. No exact percentage change is calculated across versions. A dash means no comparable observation is supplied; it is not zero. Total UK regular forces at 1 April; trained and untrained. Excludes Gurkhas and locally entered personnel. Not a measure of deployability.
1996–2026; people at 1 April. No change is calculated across definition or assessment breaks.
| Year | 2000 archive | 2012 archive | MOD series |
|---|---|---|---|
| 1996 | 221,900 | — | — |
| 1997 | 210,800 | — | — |
| 1998 | 210,100 | — | — |
| 1999 | 208,600 | — | — |
| 2000 | 207,600 | 207,610 | — |
| 2001–2005 | No comparable observations supplied | ||
| 2006 | — | 195,850 | — |
| 2007 | — | 190,670 | — |
| 2008 | — | 186,910 | — |
| 2009 | — | 188,600 | — |
| 2010 | — | 191,710 | — |
| 2011 | — | 186,360 | — |
| 2012 | — | 179,800 | 179,804 |
| 2013 | — | — | 170,712 |
| 2014 | — | — | 159,627 |
| 2015 | — | — | 153,724 |
| 2016 | — | — | 150,996 |
| 2017 | — | — | 149,366 |
| 2018 | — | — | 146,556 |
| 2019 | — | — | 144,428 |
| 2020 | — | — | 145,317 |
| 2021 | — | — | 149,280 |
| 2022 | — | — | 147,978 |
| 2023 | — | — | 142,556 |
| 2024 | — | — | 138,121 |
| 2025 | — | — | 136,998 |
| 2026 | — | — | 137,966 |
Original sources: House of Commons, Defence Statistics 2000 (Table 6, printed page 16 (PDF page 14)) · MOD, UK Defence Statistics 2012 (Table 2.5, PDF page 86). Current MOD quarterly tables. Annual snapshots differ from the latest quarterly headline.
A defined budget and scope
An affordable, testable requirement
Agreed obligations and milestones
Capacity, skills and supply chains
Equipment arrives
Standards and safety demonstrated
People, spares and maintenance
A defined capability demonstrated
Illustrative process, not a claim that every programme follows a single sequence. Stages overlap, and a delivered platform still needs people and support. Programme costs, schedules and delivery confidence →
Public plans and study contracts show investment activity. They do not reveal current stockpile adequacy or how long forces could fight.
The F-35 audit shows why engineers, spare parts and global support arrangements belong alongside equipment counts. Its findings are programme-specific.
Multi-year orders can support skills and capacity. They also commit budgets and can reduce flexibility as technology or requirements change.
Defence Committee · February 2024 · DIP · June 2026 · Dated evidence and public unknowns →

The NAO’s July 2025 audit recognised a significant capability while documenting support and staffing problems. A later RAF update reports completion of initial aircraft deliveries. Both belong in the record: later delivery is progress, but does not establish that every earlier gap has closed.
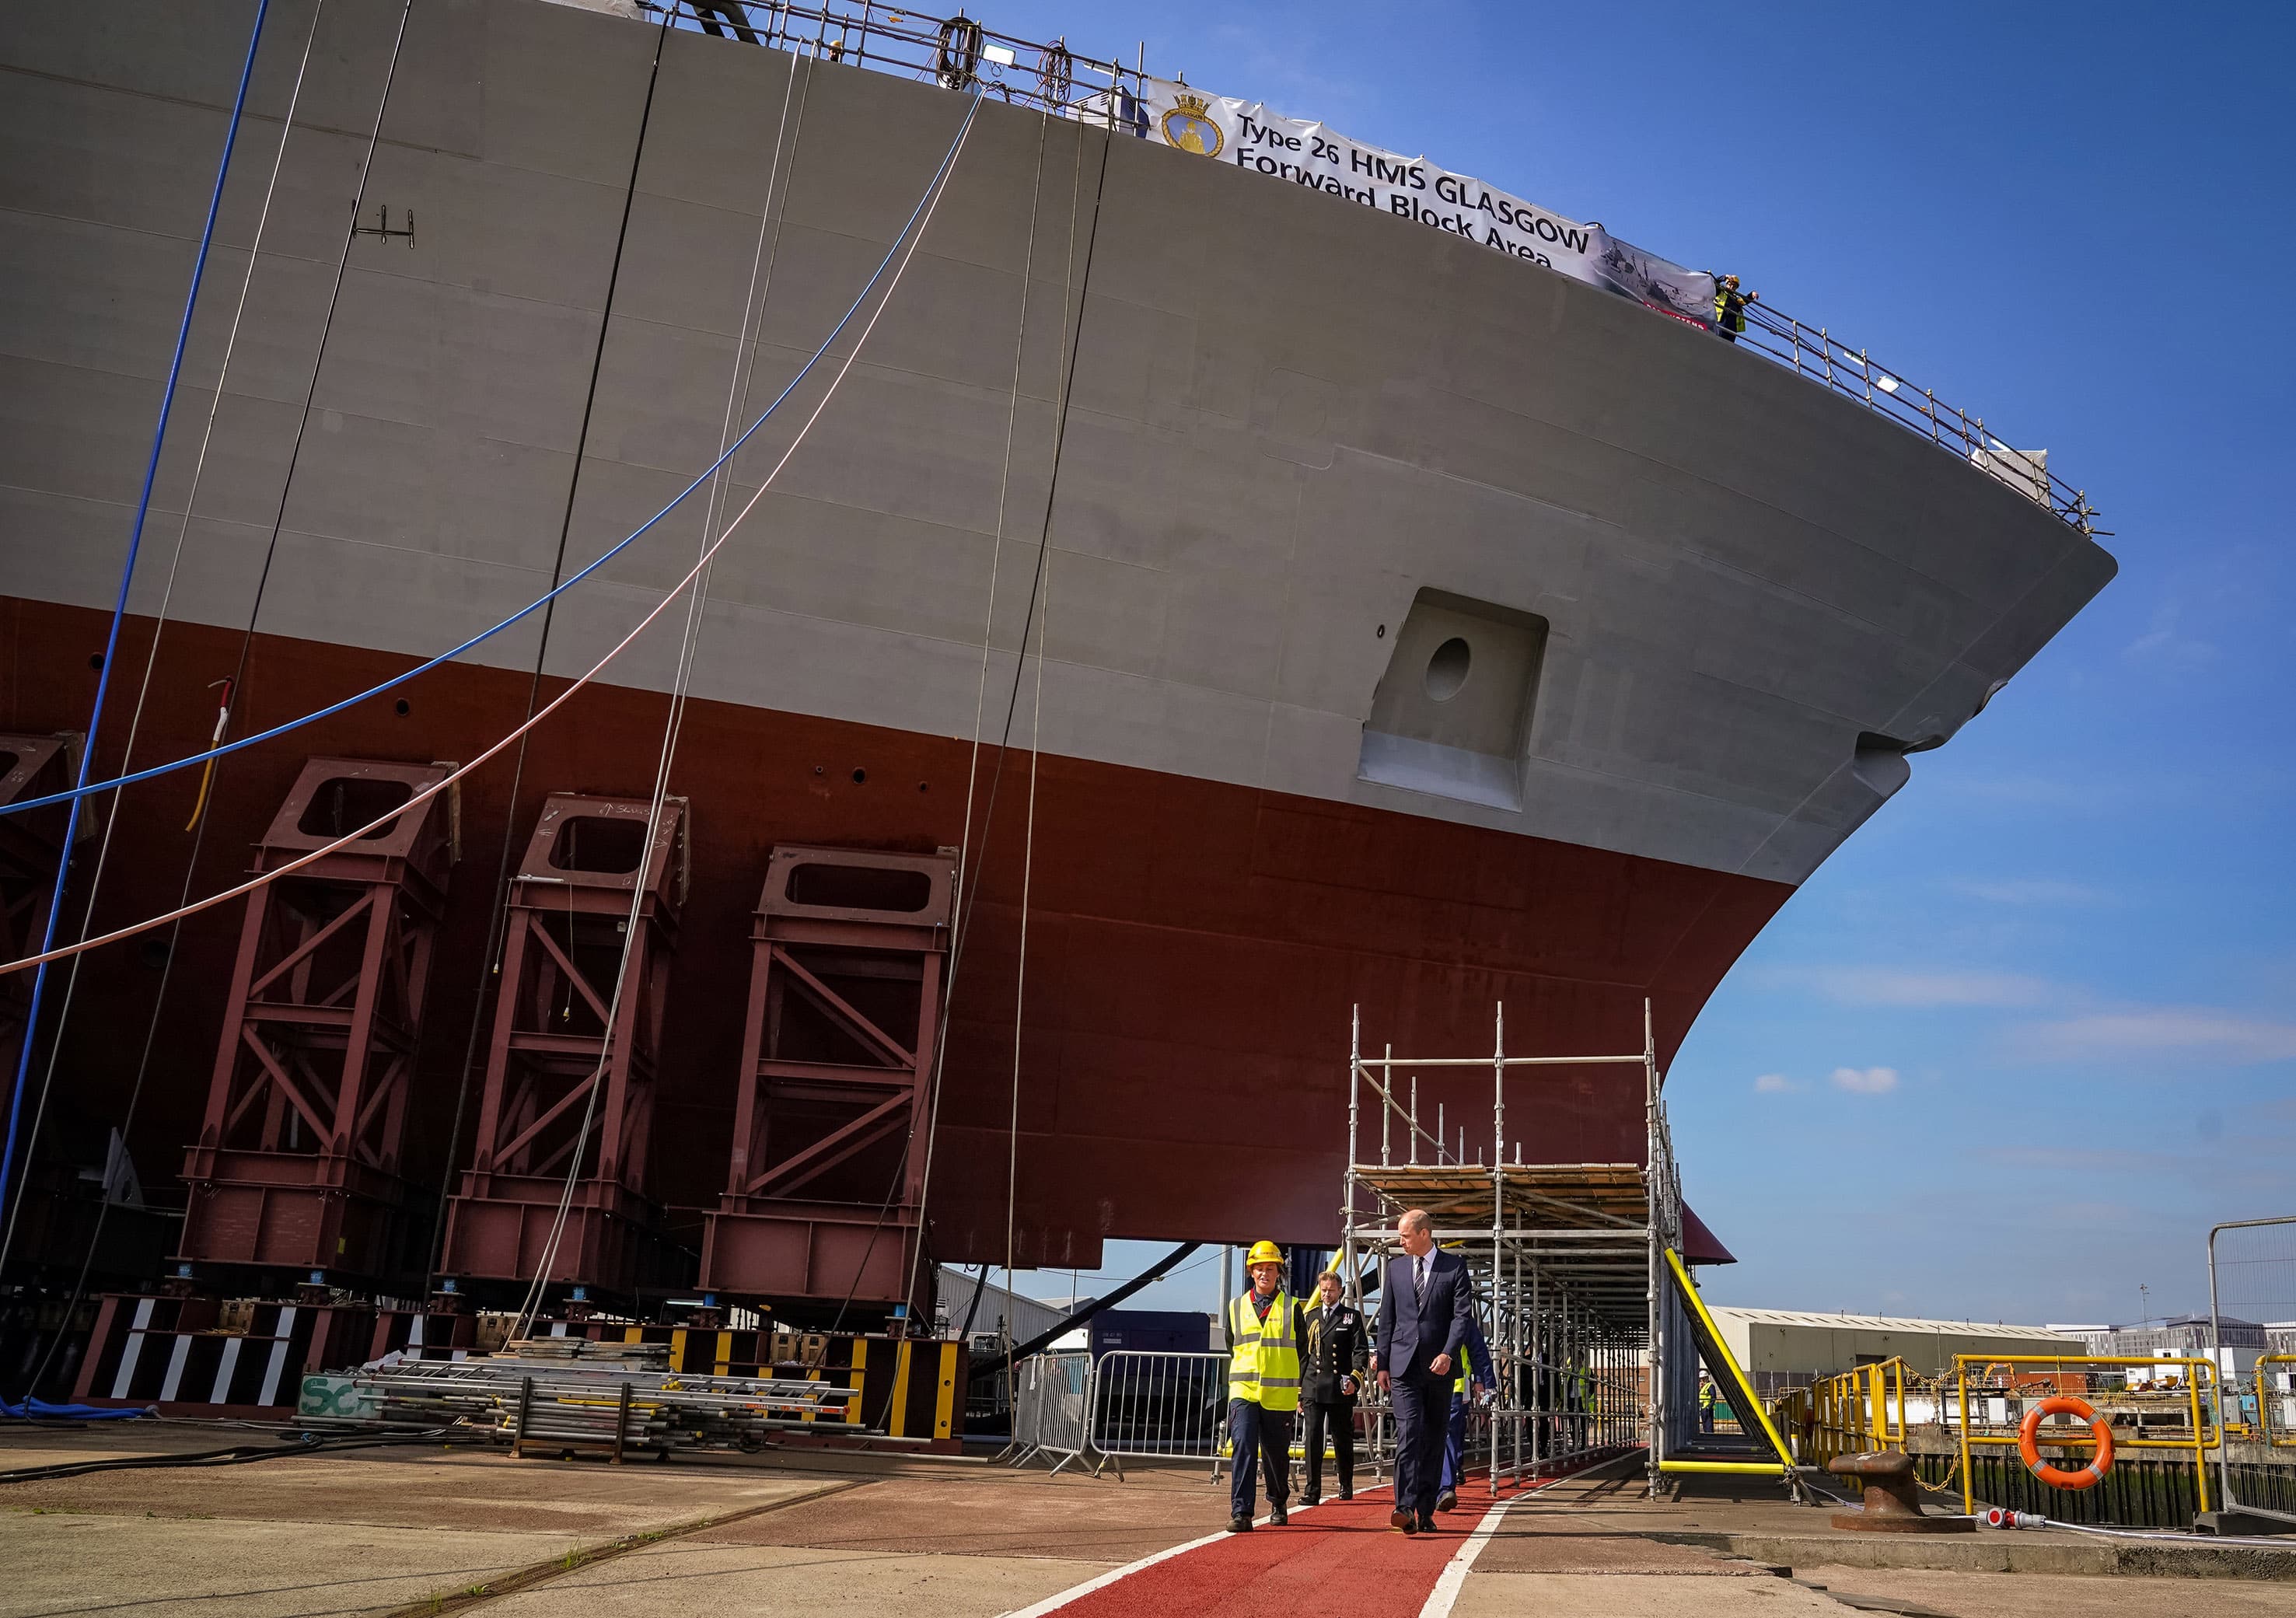
The July 2026 energetics announcement awards feasibility-study contracts. Those studies precede decisions about engineering and construction. Funding a study is a documented step; it is not evidence of munitions leaving a new factory.
In AFCAS 2026, 60% said the impact of service life on family and personal life increased their intention to leave. This is a survey response, not a count of people who left or an invented personal story. It makes predictable working patterns and family support relevant options to test.
2026
Ministry of Defence: Armed Forces Continuous Attitude Survey: 2026 · period 2026 · released 28 May 2026 · last successful refresh 10 October 2026 · Within refresh window. Official data download.
2024/25
Ministry of Defence: Defence departmental resources: 2025 · period 2024/25 · released 15 January 2026 · last successful refresh 10 October 2026 · Within refresh window. Official data download.
More money, fewer people?
MOD spending, £bn at 2024/25 prices
1996–2026 · recorded figures. Shading marks years without figures: this series starts in 2010.
UK regular forces, thousands
1996–2026 · recorded figures. Shading marks years without figures: this series starts in 2010.
Defence spending has recovered above its earlier level, while the regular forces are smaller. Neither spending nor headcount alone tells us how ready the armed forces are.
United Kingdom · Spending 2010–11–2024–25; personnel 2010–2026 · Official statistics
Left: MOD defence expenditure outturn in constant 2024–25 prices, £bn. Right: total strength of UK regular forces (trained and untrained) at 1 April, thousands.
Real spending fell from £57.1bn to £46.2bn by 2016–17 and only clearly passed its 2010–11 level in 2024–25, at £60.2bn. Regular forces shrank from 191,710 to 137,966 at 1 April 2026. The two lines answer different questions: contracts, production, training and support have distinct lead times. A 28% smaller headcount is not a 28% loss of capability.
| Financial year | Spending (£bn, real) | Regulars at 1 April after year end |
|---|---|---|
| 2010–11 | 57.1 | 186,360 |
| 2011–12 | 52.7 | 179,804 |
| 2012–13 | 47.7 | 170,712 |
| 2013–14 | 47.2 | 159,627 |
| 2014–15 | 46.2 | 153,724 |
| 2015–16 | 46.9 | 150,996 |
| 2016–17 | 46.2 | 149,366 |
| 2017–18 | 47.4 | 146,556 |
| 2018–19 | 48.1 | 144,428 |
| 2019–20 | 49.1 | 145,317 |
| 2020–21 | 49.6 | 149,280 |
| 2021–22 | 53.7 | 147,978 |
| 2022–23 | 57.6 | 142,556 |
| 2023–24 | 55.9 | 138,121 |
| 2024–25 | 60.2 | 136,998 |
Where does the defence budget go?
Staff and equipment take large shares of the defence budget. Future plans put more weight on equipment, ammunition and infrastructure; spending plans do not prove these will arrive on time.
United Kingdom · 2024–25 · Site calculation from published data
MOD defence spending by type, 2024–25, £bn cash (total £60.2bn).
Service and civilian pay together are the largest single block, at about £15.8bn. Buying military equipment and keeping it working costs about £20.1bn. Research and development has grown to £3.2bn. The plan to 2029–30 tilts further towards capital: equipment, munitions and infrastructure rather than headcount.
Source: MOD, Defence Departmental Resources 2025, Worksheet 3: Defence expenditure by commodity block (released 15 January 2026).
| Category | 2024–25 (£bn) | Share |
|---|---|---|
| Service personnel | 13.2 | 22% |
| Equipment purchase | 10.7 | 18% |
| Equipment support | 9.4 | 16% |
| Other capital | 8.9 | 15% |
| Other running costs | 6.5 | 11% |
| Infrastructure | 5.7 | 9% |
| Research and development | 3.2 | 5% |
| Civilian personnel | 2.7 | 4% |
How has the mix changed as threats changed?
Equipment spending, £bn at 2024/25 prices
1996–2026 · recorded figures. Shading marks years without figures: this series starts in 2019.
Share of defence spending
1996–2026 · recorded figures. Shading marks years without figures: this series starts in 2011.
Equipment spending has risen after inflation over the comparable period shown. This shows a change in spending priorities, not which threats the equipment can meet.
United Kingdom · 2019–20 to 2024–25 · Official statistics; shares are a site calculation
Left: estimated MOD equipment expenditure (equipment purchase, support and R&D), £bn at 2024–25 prices, 2019–20 to 2024–25. Right: shares of defence spending on personnel and on equipment purchase and support, 2011–12 to 2024–25.
On the comparable segment shown, estimated equipment expenditure reaches £27.4bn. Over the same period personnel costs fell as a share of spending while equipment rose — a clear shift in the mix, though the data cannot show which threats drove which decision.
Source: MOD, Defence Departmental Resources 2025, Worksheet 4: Estimated MOD equipment expenditure (released 15 January 2026).
| Year | Equipment spending (£bn, real) |
|---|---|
| 2019–20 | 24.2 |
| 2020–21 | 22.0 |
| 2021–22 | 24.8 |
| 2022–23 | 26.2 |
| 2023–24 | 26.1 |
| 2024–25 | 27.4 |
| Year | Total | Of which capital | Capital share |
|---|---|---|---|
| 2026–27 | £68.3bn | £26.6bn | 39% |
| 2027–28 | £73.8bn | £31.2bn | 42% |
| 2028–29 | £76.5bn | £32.7bn | 43% |
| 2029–30 | £79.1bn | £34.5bn | 44% |
Cash plan from the MOD and HM Treasury, The Defence Investment Plan (30 June 2026), so not comparable with the real-terms line above. The often-quoted £297.7bn is these four years added together. NATO-qualifying spending is planned to reach 2.7% of GDP in 2027–28; the UK has committed to 3.5% for core defence by 2035.
NATO estimates · common NATO definition · Core defence expenditure as a share of real GDP, 2021 prices. 2025 and 2026 are NATO estimates.
| Country | 2026 estimate (% GDP) |
|---|---|
| United States | 3.17 |
| Germany | 2.69 |
| United Kingdom | 2.56 |
| France | 2.22 |
| Canada | 2.13 |
| Italy | 2.10 |
| Poland | 4.68 |
NATO, Defence Investment of NATO Countries (2014–2026), Table 3 · cutoff 3 July 2026 · controlled PDF extraction reviewed 10 October 2026. NATO and MOD accounting are not interchangeable.
Government delivery
Each entry shows what its source establishes. Unknown stages stay unknown, including when a planned date has passed. This is a selected public record, not a complete inventory or completion score.
Feasibility-study contracts awarded
£0.3m · Up to this amount per feasibility study; not factory construction cost
Study contracts only. Construction, commissioning and production have not been verified here.
Source · 29 July 2026
Reviewed 10 October 2026 · next review 10 November 2026 · Controlled source extraction; independent review outstanding
Investment allocation in DIP
£5.0bn · Four-year planned investment, not wholly additional money
Portfolio allocation; no single fleet-wide delivery or operational milestone is established.
Source · 30 June 2026
Reviewed 10 October 2026 · next review 10 November 2026 · Controlled source extraction; independent review outstanding
Published maritime programme commitments
No single comparable financial value recorded.
Different ship programmes have different contract and delivery stages. No combined completion percentage.
Source · 30 June 2026
Reviewed 10 October 2026 · next review 10 November 2026 · Controlled source extraction; independent review outstanding
Investment allocation in DIP
£790m · Four-year homeland and overseas-base enhancement allocation
This allocation does not prove that all planned protection or radar capability is operational.
Source · 30 June 2026
Reviewed 10 October 2026 · next review 10 November 2026 · Controlled source extraction; independent review outstanding
Final initial-procurement aircraft delivered, RAF reports
No single comparable financial value recorded.
Delivery does not establish every aircraft’s mission availability. The RAF also reports an earlier capability declaration; no independent current availability measurement is inferred.
Source · 28 May 2026
Reviewed 10 October 2026 · next review 10 November 2026 · Controlled source extraction; independent review outstanding
Published workforce ambition
No single comparable financial value recorded.
Headcount, trained strength, specialist skills and deployability are different measures.
Source · 30 June 2026
Reviewed 10 October 2026 · next review 10 November 2026 · Controlled source extraction; independent review outstanding
Investment allocation in DIP
£2.5bn · Four-year sustainment and development allocation
An established organisation and an allocation do not independently evidence future cyber outcomes.
Source · 30 June 2026
Reviewed 10 October 2026 · next review 10 November 2026 · Controlled source extraction; independent review outstanding
Investment allocation in DIP
£3.2bn · Four-year planned investment
Programme scope changed in the DIP. Operational outcomes of the new allocation remain unverified here.
Source · 30 June 2026
Reviewed 10 October 2026 · next review 10 November 2026 · Controlled source extraction; independent review outstanding
Count resources or record survey answers. They do not provide a complete readiness score.
Show what was promised or reported. Announcing a result is different from independently checking it.
Check particular projects at a given time. Later progress can change the picture.
Tables are checked automatically and published together only after validation. Failed refreshes retain the previous snapshot; overdue checks are labelled. New evidence flags policy review rather than rewriting recommendations. Automated verification is not independent assurance. The owner has authorised documented agent review. Source verification and intended-use validation remain required; independent human assurance is not claimed.
AQuA Book, July 2025: verification, intended-use validation and independent review are distinct steps.
Readiness scrutiny timeline: February 2024 → November 2025 → PAC, June 2026 → Government plan, June 2026. These sources answer different questions; they are not a readiness time series.
Our analysis
Equipment takes time to build, people take time to train, and existing forces need maintenance and ammunition. Higher budgets cannot remove these delays overnight.
Is the equipment arriving?
Rebuilds 148 Challenger 2 tanks into Challenger 3, with a new gun, armour and sights. It is the entirety of Britain’s future main battle tank fleet.
Independent assessment · baseline end n/a · current end Conflicting source dates
A family of tracked reconnaissance vehicles for the Army, first contracted in 2014.
Independent assessment · baseline end March 2030 · current end March 2030
The deployed military IT network: the computing and communications that go with forces on operations, rather than sitting in offices.
Independent assessment · baseline end n/a · current end Conflicting source dates
A precision air-launched missile intended to be carried by the F-35B.
Departmental self-assessment · baseline end n/a · current end December 2047
Airborne early warning aircraft — the radar picture that lets the RAF see and direct air operations. The order was cut from five aircraft to three.
Departmental self-assessment · baseline end n/a · current end July 2030
Replaces the Reaper drone fleet with an aircraft certified to fly in ordinary civilian airspace.
Departmental self-assessment · baseline end n/a · current end June 2030
Many major defence programmes face serious problems with cost, timing or scope. A warning rating means delivery is at risk, not that the programme has already failed.
United Kingdom · Ratings as at 31 March 2026 · Official statistics
Delivery confidence ratings and baseline versus current end dates for a selection of MOD major programmes, as at 31 March 2026.
A Red rating means successful delivery appears at serious risk unless problems with scope, schedule or budget are resolved — not that a programme has failed. Defence has three times the share of Red projects of the rest of government (41% against 14%). Several programmes have moved their end dates; others keep the original date while being rated at risk, which is why both columns matter.
Source: NISTA, Major Projects Annual Report 2025-26 (released 13 July 2026).
| Programme | Rating | Rated by | Baseline end | Current end |
|---|---|---|---|---|
| Armour MBT (Challenger 3) | Red | Independent assessment | n/a | Conflicting source dates |
| Armoured Cavalry (Ajax) | Red | Independent assessment | March 2030 | March 2030 |
| New Style of IT (Deployed) — OpNET | Red | Independent assessment | n/a | Conflicting source dates |
| SPEAR Capability 3 | Red | Departmental self-assessment | n/a | December 2047 |
| E-7 Wedgetail | Red | Departmental self-assessment | n/a | July 2030 |
| Protector | Red | Departmental self-assessment | n/a | June 2030 |
Scroll the table sideways to see every column.
Readiness: No overall readiness percentage appears on this page because no suitable official aggregate figure has been identified. Detailed readiness information is not fully public. What follows is the public evidence, with how much weight each piece can bear stated alongside it.
Proposals to consider. The bodies named below would need to agree to deliver them; responsibility is not a recorded commitment. Follow the links for costs and evidence.
Identify the most urgent gaps in equipment maintenance, stocks and keeping specialist defence staff, while protecting sensitive information.
Who could deliver it: the Ministry of Defence, Treasury and parliamentary scrutiny bodies..
Opportunity cost to other capability; classified data cannot be fabricated to complete a public score.
Require a costed sustainment assessment alongside procurement commitments; publish only safe aggregate assurance. Low public evidence does not imply defence is unimportant or exempt from scrutiny.
Cost: The extra cost is not yet known.
Costs, drawbacks and evidence →Focus on completing work that already has funding.
Who could deliver it: Contracting authorities and Cabinet Office.
Legal disputes; supplier exits; pushing costs elsewhere.
Name contracts, renewal dates and weaknesses; recruit commercial expertise; publish baselines, performance and remedies.
Cost: The extra cost is not yet known.
Costs, drawbacks and evidence →See all options and what is still unknown →
Some problems have no assessed solution yet: see coverage and gaps.
Recorded
Budget 2026 bears on one of these findings
Real MOD spending has recovered: £60.2bn in 2024–25 against £57.1bn in 2010–11, both in 2024–25 prices.
United Kingdom · 2010–11 and 2024–25 (2024–25 prices)
A funded four-year plan gives industry visibility: defence spending of £68.3bn in 2026–27 rising to £79.1bn in 2029–30, with capital up from £26.6bn to £34.5bn.
United Kingdom · 2026–27 to 2029–30 (cash plan)
No official figure says how ready the armed forces are to fight. The 2025 Strategic Defence Review describes stockpiles as inadequate and recommends publishing availability data each year; regular forces are about 30% smaller than in 2006 while real spending is about 12% higher.
United Kingdom · 2025 review; 2026 position
PAC found insufficient detail to scrutinise the costs and scope of nuclear programmes beyond Dreadnought, despite nine programmes exceeding £10bn in whole-life costs. July accounts received a clean audit opinion; that does not establish programme value for money or readiness.
United Kingdom · June 2026 scrutiny
60% of trained regular personnel reported that the impact of service life on family/personal life increased their intention to leave. This is a weighted survey response, not observed exits or a causal estimate.
United Kingdom · 2026
Regular forces numbered 137,966 in April 2026, 28% fewer than in 2010; 122,556 were fully trained at 1 July 2026. A smaller headcount is not a proportionate loss of capability.
United Kingdom · 1 April 2010 and 1 April 2026
16 of 39 rated MOD major projects were Red, against 34 of 172 rated across government; 5 MOD ratings were withheld.
United Kingdom · Ratings at 31 March 2026
The February 2024 Defence Committee assessment found warfighting readiness in doubt: every service had capability shortfalls and stockpile shortages and was losing personnel faster than it recruited. Readiness data once published are now withheld.
United Kingdom · January 2024
Setting requirements with budget and technical authority together, and funding stocks, maintenance and training first, could turn the rising budget into usable readiness faster.
Depends on: The MOD identifies binding readiness gaps and stages new equipment against what industry can deliver.
our synthesis
Cost growth and long lead times can outrun plans: the NAO found the 2023–2033 equipment plan £16.9bn over budget, with deficits growing in the nuclear deterrent and naval and air programmes.
risk
Budget 2026 bears on this
Capital is reallocated to fully fund the Defence Investment Plan alongside further savings; whether that covers programmes already over budget is the test.
Defence Investment Plan (DIP)Defence Investment PlanTrack delivery →
Proposed
Possible steps for government and the bodies responsible. These describe the order of work, not promised dates: starting an action and seeing results take different amounts of time.
Short term · prepare
Separate equipment, staffing and readiness gaps.
Medium term · deliver
Assess procurement and support needs against available people and funding.
Long term · judge results
Judge readiness and usable capability, not spending alone.
Britain’s regular forces are 28% smaller than in 2010. Real defence spending is 5% higher.
There were 137,966 UK Regular Forces personnel (excluding Gurkhas and reserves) on 1 April 2026, against 191,710 on 1 April 2010: 28.0% fewer. MOD’s defence spending, in 2024–25 prices, was £60.2bn in 2024–25 against £57.1bn in 2010–11: 5.4% higher. Both comparisons start in 2010 and end on the latest published data (personnel April 2026, spending 2024–25); the spending series starts in 2010–11 because the basis changed that year. Fewer people for similar money is not a verdict on capability. Readiness is not published: official statements describe stockpiles as inadequate and one major aircraft's availability as about half its target. About 15% of spending with industry is for work done overseas, 6% of it paid to the US government. For a longer view, the 1 April 2006 count was 195,850 (30% fewer by 2026). A smaller headcount is not a proportionate loss of capability.
Headcount rose slightly in the latest year; it is not a measure of capability.
16 of 39 of rated programmes are Red41.0% of the circle
44 programmes in the portfolio; five ratings are withheld.
Britain’s regular forces are 28% smaller than in 2010. Real defence spending is 5% higher. There were 137,966 UK Regular Forces personnel (excluding Gurkhas and reserves) on 1 April 2026, against 191,710 on 1 April 2010: 28.0% fewer. MOD’s defence spending, in 2024–25 prices, was £60.2bn in 2024–25 against £57.1bn in 2010–11: 5.4% higher. Both comparisons start in 2010 and end on the latest published data (personnel April 2026, spending 2024–25); the spending series starts in 2010–11 because the basis changed that year. Fewer people for similar money is not a verdict on capability. Readiness is not published: official statements describe stockpiles as inadequate and one major aircraft's availability as about half its target. About 15% of spending with industry is for work done overseas, 6% of it paid to the US government. For a longer view, the 1 April 2006 count was 195,850 (30% fewer by 2026). A smaller headcount is not a proportionate loss of capability.
| Measure | Value | Period | Geography | Type | Source |
|---|---|---|---|---|---|
| MOD expenditure in real terms, 2010–11 (2024–25 prices) | £57.1bn | 2010–11 | United Kingdom | derived calculation | MOD, Defence Departmental Resources 2025 |
| MOD expenditure in real terms, 2024–25 (2024–25 prices) | £60.2bn | 2024–25 | United Kingdom | derived calculation | MOD, Defence Departmental Resources 2025 |
| UK regular forces, 2010 | 191,710 | 2010 | United Kingdom | administrative count | MOD, Quarterly service personnel statistics |
| UK regular forces, 2026 | 137,966 | 2026 | United Kingdom | administrative count | MOD, Quarterly service personnel statistics |
| Fall in UK regular forces since 2010Calculation: (1 − latest ÷ 2010) × 100 | 28% smaller | 2026 | United Kingdom | derived calculation | MOD, Quarterly service personnel statistics |
| MOD major programmes rated Red | 16 | 2025–26 | United Kingdom | administrative count | NISTA, Major Projects Annual Report 2025–26, data CSV |
| MOD major programmes with a published delivery-confidence ratingCalculation: 44 programmes − 5 withheld ratings | 39 | 2025–26 | United Kingdom | administrative count | NISTA, Major Projects Annual Report 2025–26, data CSV |
| MOD major programmes in the portfolio | 44 | 2025–26 | United Kingdom | administrative count | NISTA, Major Projects Annual Report 2025–26, data CSV |
| Share of rated MOD major programmes rated RedCalculation: Red ÷ rated programmes × 100 | 41% | 2025–26 | United Kingdom | derived calculation | NISTA, Major Projects Annual Report 2025–26, data CSV |
Available images and their source records are listed on Shareable visuals.

