Headline evidence · Brexit · United Kingdom · trade 2019 to 2025
Nearly two in three Britons say leaving the EU has gone badly. Fewer than one in twelve say it has gone well.
Nearly two in three Britons say leaving the EU has gone badly and fewer than one in twelve say it has gone well. That is a judgement, not a measurement: goods exports to the EU are lower than in 2019, and the long-run effect is modelled.
Proposed outcome: Show which trade barriers could be reduced, what rules would need to change and which choices Britain would give up. What could change →
- Geography
- Great Britain, adults 18+
- Evidence period
- July to December 2024
- Evidence status
- Survey-based
- Editorial review
- Reviewed 11 October 2026
The short version
Three key measures
Survey-based evidence
British Election Study 2024Fieldwork: July to December 2024Random-probability survey of adults in Great Britain, July to December 2024, weighted; sample 3,089. Estimates have sampling uncertainty of about 2 points.How do people think leaving the EU has gone?
64%say badly
About two in three British adults say leaving the EU has gone badly and fewer than one in twelve say well. Even among people who voted Leave, more say badly than well.
How we got here and where we are now →Great Britain, adults 18+ · July to December 2024 · Survey-based
Definition, limits and source: How do people think leaving the EU has gone?
64.2% of adults in Great Britain said leaving the EU has gone very or quite badly, and 8.1% quite or very well; 24.8% said neither. Among people who recall voting Leave in 2016, 36.8% said badly and 17.2% well. A YouGov poll in June 2026 found 57% say it was wrong to leave and 30% right. These are perceptions at different dates, by different providers: not a measure of what leaving has done, and not an average.
Survey-based · British Election Study 2024 Post-Election Random Probability Survey (UK Data Service SN 9502), question P02A
How did goods exports to the EU change?
−14%vs 2019, by volume
The change in goods exports to the European Union since 2019, after price changes. Other shocks and measurement changes also matter.
Trade in goods and services →United Kingdom · 2019 to 2025
Definition, limits and source: How did goods exports to the EU change?
UK goods exports to the EU in 2025 against 2019, excluding precious metals and price changes. To non-EU countries: −8%. Since January 2021 EU-bound goods need customs declarations and food and plant checks. An observed comparison, not a measured estimate of Brexit’s effect: a 2021 measurement break and other shocks sit in the same years.
Site calculation from published data · ONS, UK trade time series (MRET), chained volume measures, CDIDs JIM8, JIN3, JIM7, JIN2 (goods excluding precious metals); IKBE, IKBF (services)
What do forecasters estimate it costs in the long run?
4%lower productivity (modelled)
An estimate of how much less the economy would produce per hour in the long run than without Brexit. That alternative cannot be observed.
Investment and productivity estimates →United Kingdom · Long run (OBR); to end-2025 (NBER)
Definition, limits and source: What do forecasters estimate it costs in the long run?
The OBR assumes long-run productivity 4% below where it would have been inside the EU — an estimate against a path that cannot be observed. An NBER study puts GDP 6% to 8% lower by the end of 2025. Different measures, different methods.
Modelled scenario · Office for Budget Responsibility, Brexit analysis
Who feels this most?
The costs of new border paperwork are mostly fixed per consignment, so they weigh most on small exporters. The most detailed academic study of UK–EU trade after 2021 found a large and lasting drop in the number of low-value export relationships, alongside a 25% fall in imports from the EU relative to the rest of the world. Trade in detail.
Which barriers can Britain now remove?
- Food and plant checks — closest to removal. A UK–EU agreement on sanitary and phytosanitary (SPS) rules, agreed in principle in May 2025 and still being negotiated, would remove export health certificates and most routine checks. The price is following EU food and plant rules in those areas without a vote on them. Defra’s intended start is mid-2027, subject to negotiations. Read the decision brief; Defra’s timetable.
- Carbon border charges — under negotiation. Linking the UK and EU carbon markets would exempt UK goods from the EU’s carbon border levy.
- Customs declarations and rules of origin — stay. Declarations remain even inside a customs union; rules-of-origin checks go only inside one. The single market would remove most other goods and services barriers but brings back free movement. Compare all the options.
The evidence
How we got here
Britain voted to leave by 52% to 48% on a turnout of 72% in June 2016, a margin of about 1.27 million votes. In the 1975 referendum, two in three voted to stay in. The vote split sharply by age and education: day-of-poll polling found about three in four 18 to 24s voted Remain and three in five over-65s voted Leave. The reasons voters gave most often were about control: nearly half of Leave voters said decisions about the UK should be taken in the UK, and a third wanted control over immigration. Among Remain voters, 43% said the risks of leaving looked too great. Campaign claims such as the £350 million a week figure were contested at the time. The timeline follows the story from there.
Leave 51.9%Remain 48.1%
Share of each group voting as stated. Lord Ashcroft Polls, day-of-poll survey of 12,369 voters (a poll, not the count).
- Aged 18 to 24: Remain73%
- Aged 25 to 34: Remain62%
- Aged 65 and over: Leave60%
- Degree holders: Remain57%
- Higher degree: Remain64%
Where people think we are now
Survey-based evidence
British Election Study 2024Fieldwork: July to December 2024Random-probability survey of adults in Great Britain, July to December 2024, weighted; sample 3,089. Estimates have sampling uncertainty of about 2 points.
Nearly two in three say leaving has gone badly, and fewer than one in twelve say it has gone well. Opinion is split by how people voted in 2016, but even among Leave voters more say it has gone badly than well. Other surveys by YouGov and Ipsos find a majority would rejoin or apply to rejoin, though results depend on the question. The Office for Budget Responsibility assumes UK trade intensity is about 15% lower and productivity about 4% lower in the long run than if the UK had stayed in the EU. This is a modelled counterfactual, not an observation.
32%32%25%8%
- Very badly: 32.3%
- Quite badly: 31.9%
- Neither: 24.8%
- Well (quite or very): 8.1%
- Don’t know: 3.0%
Different providers, question wording, modes and dates. They are shown side by side and are not averaged or read as a trend.
- YouGov (2 to 3 June 2026): wrong to leave57%
- YouGov: right to leave30%
- Ipsos (14 to 20 May 2026): apply to rejoin52%
- Ipsos: stay out33%
- British Election Study 2024: rejoin57%
- British Election Study: stay out28%
Annual data: Trade volumes by destination and sector
Comparable observations begin in 1997 and end in 2025; 1996 and 2026 are unavailable. EU goods have a January 2021 recording break, so changes across it are indicative. Services cover all partners; there is no comparable EU/non-EU volume split. A dash means no comparable observation is supplied; it is not zero. UK trade flows; goods exclude precious metals.
1996–2026; Volume index, 2019 = 100. No change is calculated across definition or assessment breaks.
| Year | Goods exports: EU | Goods exports: non-EU | Goods imports: EU | Goods imports: non-EU | Services exports: all | Services imports: all |
|---|---|---|---|---|---|---|
| 1996 | No comparable observations supplied | |||||
| 1997 | 74.1 | 54.1 | 42.7 | 45.7 | 36 | 38.3 |
| 1998 | 77.1 | 50.7 | 45.8 | 48.8 | 39.1 | 41 |
| 1999 | 80.1 | 51.1 | 48.9 | 52.2 | 41.1 | 44.7 |
| 2000 | 87 | 57.2 | 51.9 | 60 | 45 | 47.6 |
| 2001 | 90.1 | 56.9 | 57.8 | 61.2 | 46.2 | 48.8 |
| 2002 | 92.7 | 56 | 63.7 | 59.3 | 46.2 | 50.8 |
| 2003 | 86.8 | 59.8 | 63.2 | 61.7 | 49.6 | 52.8 |
| 2004 | 86.7 | 61.8 | 66.1 | 68.7 | 54.8 | 56.6 |
| 2005 | 90.7 | 69.3 | 72.4 | 73.1 | 58.7 | 59.1 |
| 2006 | 112.8 | 67.7 | 83.3 | 78.7 | 64.3 | 61.3 |
| 2007 | 95.2 | 68.9 | 77.7 | 82.4 | 70.9 | 63 |
| 2008 | 91.6 | 72.8 | 76.1 | 81.7 | 74.8 | 62.4 |
| 2009 | 84.1 | 66.6 | 67.8 | 77.2 | 69.7 | 59.4 |
| 2010 | 89.5 | 75.3 | 74.4 | 85.8 | 71.1 | 62.4 |
| 2011 | 93 | 81.9 | 77.7 | 87.5 | 76.2 | 63 |
| 2012 | 88.1 | 85 | 81.3 | 87 | 78.5 | 65.1 |
| 2013 | 87.1 | 85.2 | 84.2 | 86 | 79.4 | 67.2 |
| 2014 | 89.7 | 85.1 | 88.4 | 88.3 | 79.9 | 72.7 |
| 2015 | 91.4 | 89.5 | 92.3 | 92.1 | 83.2 | 79.8 |
| 2016 | 95.3 | 90.4 | 96.4 | 96.3 | 87.2 | 83.3 |
| 2017 | 101.3 | 96.9 | 98.7 | 98.7 | 93 | 87.8 |
| 2018 | 101.4 | 99.6 | 100.1 | 97.4 | 98.5 | 96.4 |
| 2019 | 100 | 100 | 100 | 100 | 100 | 100 |
| 2020 | 87.5 | 87.2 | 86.7 | 91.6 | 89.3 | 77.2 |
| 2021 | 86 | 91.6 | 87.3 | 103.9 | 94.2 | 78.6 |
| 2022 | 94.3 | 94.8 | 98 | 110 | 109.9 | 100 |
| 2023 | 89.1 | 94.6 | 98.2 | 101.8 | 112.7 | 108.2 |
| 2024 | 86.5 | 92.3 | 97.2 | 102.8 | 120.9 | 115 |
| 2025 | 85.8 | 91.7 | 98 | 109.8 | 126.5 | 118.5 |
| 2026 | No comparable observations supplied | |||||
Border delivery: what the audit found
The NAO’s May 2024 report found that repeated delays increased uncertainty and avoidable costs. It called for clearer accountability and performance measures. Its evidence ended in April 2024, so this is a delivery lesson, not a claim that today’s controls are unchanged.
NAO, The UK border: implementing an effective trade borderWhat changed, and how do we know?
Brexit is three different kinds of question. Some answers are legal facts with a date. Some are measured by official statistics. The largest — what the economy would look like had the UK stayed — can only be estimated by models. The ledger keeps them apart and says how strong each piece of evidence is.
What changed, and how do we know?
The legal changes are certain; the trade frictions are measurable; the economy-wide cost is an estimate
Each row separates a dated legal change, what official statistics show happened, and what models estimate relative to staying in the EU. Columns are not scored or added: an empty cell means no reliable evidence, not zero effect.
- Legal fact
- Strong evidence
- Moderate evidence
- Limited evidence
- No reliable estimate
Immigration
31 Dec 2020Legal or institutional change
What the law or treaty now says
Legal factEU free movement ended for new arrivals. UK visa rules generally apply, with continuing Irish citizens’ Common Travel Area rights and Withdrawal Agreement protections.
Observed outcome
What official statistics show happened
Strong evidenceOn ONS’s current series, EU+ net migration went from +322k (year to June 2016, EU nationals) to −42k (year to December 2025, EU+ nationals). Non-EU+ rose to +1,047k, then fell to +350k. ONS advises caution comparing across June 2021, when its method and the EU+ definition changed.
Modelled estimate
Compared with staying in the EU — not observed
No reliable estimateNo widely used estimate of migration without Brexit.
More on immigration →Who is affected, limits and sources
- Who is affected:
- EU citizens; employers in care, hospitality, food processing and haulage that relied on EU recruitment.
- Limits of the evidence:
- Migration estimates are provisional and heavily revised; the 2016 figure is ONS’s current back estimate, not the survey figure published at the time. The non-EU rise reflects later visa policy, not the end of free movement itself.
Goods trade
1 Jan 2021Legal or institutional change
What the law or treaty now says
Legal factThe UK left the single market and customs union. The Trade and Cooperation Agreement keeps zero tariffs for goods meeting rules of origin, but adds customs declarations and food and plant checks.
Observed outcome
What official statistics show happened
Moderate evidenceGoods exports to the EU −14% by volume since 2019; to non-EU −8%. Imports from the EU −2%; from elsewhere +10%.
Modelled estimate
Compared with staying in the EU — not observed
Moderate evidenceCEP/LSE study: the trade deal caused a sudden, persistent 25% fall in imports from the EU relative to the rest of the world, a smaller and temporary relative fall in exports, and the loss of many small export relationships. OBR: trade intensity 15% lower in the long run.
More on goods trade →Who is affected, limits and sources
- Who is affected:
- Small exporters (paperwork costs are per consignment), food and farming businesses, manufacturers with EU supply chains.
- Limits of the evidence:
- A measurement break in EU goods data from January 2021; the pandemic and energy shock hit the same years.
- Sources:
- UK Government, Agreements reached between the UK and the EU (Trade and Cooperation Agreement, December 2020); ONS, UK trade time series (MRET), chained volume measures; Freeman, Manova, Prayer and Sampson, “UK trade in the wake of Brexit”, CEP Discussion Paper 1847 (LSE); Office for Budget Responsibility, Brexit analysis
Services trade
1 Jan 2021Legal or institutional change
What the law or treaty now says
Legal factNo automatic right to sell services across the EU and no blanket recognition of professional qualifications; firms need authorisation member state by member state.
Observed outcome
What official statistics show happened
Moderate evidenceServices exports to all partners +26% by volume since 2019. ONS publishes the EU/non-EU split only in current prices.
Modelled estimate
Compared with staying in the EU — not observed
No reliable estimateNo estimate on this site that isolates the effect on services.
More on services trade →Who is affected, limits and sources
- Who is affected:
- Professional, financial and creative services firms; touring performers.
- Limits of the evidence:
- Without an EU split in volume terms, services growth cannot be attributed to particular markets.
Investment, productivity and GDP
2016 onwardsLegal or institutional change
What the law or treaty now says
No reliable estimateNo single legal change: the effect runs through uncertainty from the 2016 vote and through trade costs from 2021.
Observed outcome
What official statistics show happened
Moderate evidenceBusiness investment +14% on 2016 Q2 by 2026 Q2. Observed growth does not show what would have happened otherwise.
Modelled estimate
Compared with staying in the EU — not observed
Moderate evidenceOBR: long-run productivity 4% lower than if the UK had remained, two-fifths of it already by 2021. NBER (Bloom et al.): GDP 6% to 8%, investment 12% to 13% and productivity 3% to 4% lower by end-2025.
More on investment, productivity and gdp →Who is affected, limits and sources
- Who is affected:
- Everyone through incomes and tax revenue; the estimates are economy-wide averages, not effects on each household.
- Limits of the evidence:
- Counterfactuals cannot be observed. The estimates use different measures and methods and should not be swapped for one another.
Trade policy
2023–2024Legal or institutional change
What the law or treaty now says
Legal factAn independent trade policy: new agreements with Australia and New Zealand (in force 2023) and accession to the CPTPP (2024).
Observed outcome
What official statistics show happened
No reliable estimateToo recent to measure separately from other trade changes.
Modelled estimate
Compared with staying in the EU — not observed
Moderate evidenceGovernment impact assessments: Australia +0.08% of GDP by 2035, New Zealand +0.03%, CPTPP about £2bn a year by 2040.
More on trade policy →Who is affected, limits and sources
- Who is affected:
- Exporters to those markets; UK farmers facing more import competition.
- Limits of the evidence:
- The government’s own models; small relative to the estimated EU effect, and not designed to offset it.
Regulation, subsidies, farming and fishing
2020–2023Legal or institutional change
What the law or treaty now says
Legal factNew UK regimes for farm support (Agriculture Act 2020), fishing (Fisheries Act 2020) and subsidies (Subsidy Control Act 2022), and powers to revoke or amend retained EU law (2023).
Observed outcome
What official statistics show happened
No reliable estimateNo single official measure of how far UK rules have diverged, or of the effect of divergence.
Modelled estimate
Compared with staying in the EU — not observed
No reliable estimateNo reliable aggregate estimate.
More on regulation, subsidies, farming and fishing →Who is affected, limits and sources
- Who is affected:
- Farmers facing different devolved support transitions, fishing fleets, and firms selling into both markets.
- Limits of the evidence:
- Using the freedom to diverge can raise costs for firms that must also meet EU rules; how much it has been used is contested.
Northern Ireland
2021; Feb 2023Legal or institutional change
What the law or treaty now says
Legal factNorthern Ireland follows EU goods rules and keeps an open land border; goods from Great Britain pass checks in the Irish Sea, eased by the Windsor Framework. The Assembly voted in December 2024 to continue the arrangements, without cross-community support.
Observed outcome
What official statistics show happened
Limited evidenceSee the Northern Ireland chapter: power-sharing was suspended from February 2022 to February 2024.
Modelled estimate
Compared with staying in the EU — not observed
No reliable estimateNo reliable estimate of the net economic effect of dual market access.
More on northern ireland →Who is affected, limits and sources
- Who is affected:
- Northern Ireland businesses and consumers; traders moving goods from Great Britain.
- Limits of the evidence:
- Economic effects are hard to separate from the wider UK picture.
Read across a row, not down a column. Two things are certain: UK decision-making powers changed, subject to treaty commitments and specific exceptions, and goods trade with the EU carries costs it did not before 2021. The observed trade change is moderately strong evidence of friction, weakened by a measurement break and the pandemic. The economy-wide cost rests on models: the OBR and the main academic study both estimate a cost, on different measures and of different sizes. There is no agreed rate for converting autonomy into GDP, so no total is given.
Did goods and services trade follow the same path?
Goods exports to the EU are 14% below 2019; services exports are 26% above
Goods exports, by destination
1996–2026 · recorded figures.
Services, all partners
1996–2026 · recorded figures.
The gap in the EU goods line marks the January 2021 change from survey returns to customs declarations. Both panels share the same scale.
Goods exports to the European Union are below 2019, while services exports are higher. New border checks are part of the context, but these changes do not isolate Brexit from other shocks.
United Kingdom · 1997 to 2025, calendar years · Accredited official statistics; recent years are revised as new data arrive
Show the workings — Goods exports to the EU are 14% below 2019; services exports are 26% above
Two panels, each indexed to 2019 = 100. First panel: UK goods exports by destination, excluding precious metals. Second panel: UK services exports and imports, all partners (ONS publishes services volumes only for the world total).
By volume, goods exports to the EU in 2025 were 14% below 2019; to the rest of the world, 8% below. That gap is consistent with new border frictions, but it is not a clean measure of Brexit: the measurement break and other shocks sit in the same years. Services exports grew 26% over the same period. Neither line shows what trade would have been inside the EU.
- Geography:
- United Kingdom — UK trade in goods and services, balance-of-payments basis
- Measure:
- Volume index, 2019 = 100 (chained volume measures, seasonally adjusted)
- Period:
- 1997 to 2025, calendar years
- Status:
- Accredited official statistics; recent years are revised as new data arrive
- Calculation:
- Site calculation: each ONS chained-volume series divided by its own 2019 value × 100. Volumes remove price changes, so nominal and real values are not mixed.
- Compare with:
- Each series’ own 2019 level; goods exports to non-EU countries (−8%) as a partial control for shocks that hit all trade
- Not included / breaks:
- A structural break in EU goods trade from January 2021 (customs declarations replaced the Intrastat survey), shown as a gap in the EU line. The pandemic and the 2022 energy shock fall inside the same window. Precious metals are excluded because gold flows through London swamp the non-EU figures. A services split by EU and non-EU exists only in current prices, so it is not compared here.
Source: ONS, UK trade time series (MRET), chained volume measures, CDIDs JIM8, JIN3, JIM7, JIN2 (goods excluding precious metals); IKBE, IKBF (services) (released 11 September 2026).
View the data as a table
| Year | Goods exports to EU | Goods exports to non-EU | Services exports (all) | Services imports (all) |
|---|---|---|---|---|
| 1997 | 74.1 | 54.1 | 36.0 | 38.3 |
| 1998 | 77.1 | 50.7 | 39.1 | 41.0 |
| 1999 | 80.1 | 51.1 | 41.1 | 44.7 |
| 2000 | 87.0 | 57.2 | 45.0 | 47.6 |
| 2001 | 90.1 | 56.9 | 46.2 | 48.8 |
| 2002 | 92.7 | 56.0 | 46.2 | 50.8 |
| 2003 | 86.8 | 59.8 | 49.6 | 52.8 |
| 2004 | 86.7 | 61.8 | 54.8 | 56.6 |
| 2005 | 90.7 | 69.3 | 58.7 | 59.1 |
| 2006 | 112.8 | 67.7 | 64.3 | 61.3 |
| 2007 | 95.2 | 68.9 | 70.9 | 63.0 |
| 2008 | 91.6 | 72.8 | 74.8 | 62.4 |
| 2009 | 84.1 | 66.6 | 69.7 | 59.4 |
| 2010 | 89.5 | 75.3 | 71.1 | 62.4 |
| 2011 | 93.0 | 81.9 | 76.2 | 63.0 |
| 2012 | 88.1 | 85.0 | 78.5 | 65.1 |
| 2013 | 87.1 | 85.2 | 79.4 | 67.2 |
| 2014 | 89.7 | 85.1 | 79.9 | 72.7 |
| 2015 | 91.4 | 89.5 | 83.2 | 79.8 |
| 2016 | 95.3 | 90.4 | 87.2 | 83.3 |
| 2017 | 101.3 | 96.9 | 93.0 | 87.8 |
| 2018 | 101.4 | 99.6 | 98.5 | 96.4 |
| 2019 | 100.0 | 100.0 | 100.0 | 100.0 |
| 2020 | 87.5 | 87.2 | 89.3 | 77.2 |
| 2021 | 86.0 | 91.6 | 94.2 | 78.6 |
| 2022 | 94.3 | 94.8 | 109.9 | 100.0 |
| 2023 | 89.1 | 94.6 | 112.7 | 108.2 |
| 2024 | 86.5 | 92.3 | 120.9 | 115.0 |
| 2025 | 85.8 | 91.7 | 126.5 | 118.5 |
Scroll the table sideways to see every column.
Also in this section
- How Brexit happened — 1973 to 2026, including the 2016 result.
- What was promised — campaign claims from both sides, checked.
- Where Britain gained — the new powers and how they have been used.
- Who paid for the campaigns — reported referendum spending.
Why it is happening
Our analysis
New border requirements create work for businesses, especially smaller exporters. Reducing those barriers requires agreements and choices about shared rules and national control.
Who is affected most
Who feels this most?
Food and farming businesses face the heaviest checks: animal and plant products need export health certificates and can be physically inspected — the area a UK–EU food-safety agreement is meant to address. Northern Ireland has a position unlike any other region: access to both markets for goods, and a trade border with Great Britain. Northern Ireland.
EU citizens and the employers who recruited them felt the end of free movement most directly: EU+ net migration went from +322k in the year to June 2016 to −42k in the year to December 2025. Migration’s changing composition.
What could change
Proposals to consider. The bodies named below would need to agree to deliver them; responsibility is not a recorded commitment. Follow the links for costs and evidence.
Cut EU trade friction with a scoped food-and-farm deal
Agree food and farming rules with the European Union to reduce trade barriers.
Who could deliver it: UK government and EU counterparts; relevant devolved authorities.
Main trade-off and delivery needs
External agreement required; regulatory autonomy and uneven sector impacts.
Define covered goods, alignment, oversight and border changes; secure agreement and business transition.
Cost: The extra cost is not yet known.
Costs, drawbacks and evidence →
See all options and what is still unknown →
Some problems have no assessed solution yet: see coverage and gaps.
Domain SWOT
Recorded
Show the findings
Strengths · 2 findings
There is a working treaty base to build on: the Trade and Cooperation Agreement, and a May 2025 Common Understanding committing both sides to negotiate an agri-food (SPS) agreement.
United Kingdom and EU · TCA in force from 2021; Common Understanding 19 May 2025
Services exports, mostly untouched by border checks, were +26% higher in volume in 2025 than in 2019.
United Kingdom · 2019 to 2025
Weaknesses · 4 findings
The OBR assumes UK trade intensity about 15% lower and productivity about 4% lower in the long run than if the UK had stayed in the EU. This is a modelled counterfactual, not an observation, and about 64% of British adults say leaving has gone badly: a perception, not a measure.
Depends on: The estimate depends on the OBR’s assumptions about trade intensity and productivity compared with a no-Brexit counterfactual; it is not observed.
United Kingdom · Updated July 2026 · modelled estimate
The NAO found that repeated border-control delays created uncertainty and avoidable costs, and called for clearer accountability and performance measures. This dated audit does not establish the current operating position.
United Kingdom · Audit published May 2024; evidence to April 2024
Goods exports to the EU were −14% in volume between 2019 and 2025, against −8% to the rest of the world; the EU series has a recording break in January 2021.
United Kingdom · 2019 to 2025
The new rules cut the number of product-country varieties exported to the EU by about 30%, driven by the loss of low-value trade relationships — consistent with smaller exporters leaving smaller EU markets.
United Kingdom · 2021 (published April 2022)
Opportunities · 1 finding
A concluded SPS agreement would remove most export health certificates and routine checks on agri-food trade, and practical help could make the remaining processes usable for small firms.
Depends on: Negotiations conclude, implementing legislation passes, and the UK accepts dynamic alignment with EU SPS rules in scope.
our synthesis
Threats · 2 findings
The agreement is not yet concluded: the July 2026 summit was postponed after the change of government, exceptions such as gene editing were still being negotiated, and alignment obligations would limit future divergence.
risk
Barriers are rising outside the EU too: after US tariffs from April 2025, UK goods exports to the United States fell 10.2% in 2025 (current prices), against 1.8% for all UK goods exports, and in April 2026 most UK goods still faced a 10% US tariff while the May 2025 deal was only partly implemented.
United Kingdom · 2024 to 2025; tariffs as at April 2026 · risk
Domain action plan
Proposed
Possible steps for government and the bodies responsible. These describe the order of work, not promised dates: starting an action and seeing results take different amounts of time.
Short term · prepare
Identify trade barriers that a specific agreement could address.
Medium term · deliver
Negotiate and implement agreed changes with businesses and trading partners.
Long term · judge results
Measure reduced friction alongside remaining barriers and wider trade changes.
Delivery steps and owners (4)
- Prerequisite: Conclude SPS negotiations and publish scope and exceptions · UK government (Defra, Cabinet Office) and European Commission · proposed
- Decision: Pass implementing legislation (an anticipated European Partnership Bill) · Parliament · proposed
- Delivery: Operate the agreement; pilot support for a cohort of small exporters · Defra, FSA and port health authorities; Department for Business and Trade · Summer 2027 (FSA planning assumption, not an agreed date)
- Result: Certificates, border delays and exporter numbers against comparable trade · Defra; HMRC trade statistics; ONS · proposed
Sources, method and changes
Shareable visual summary
Visual summary
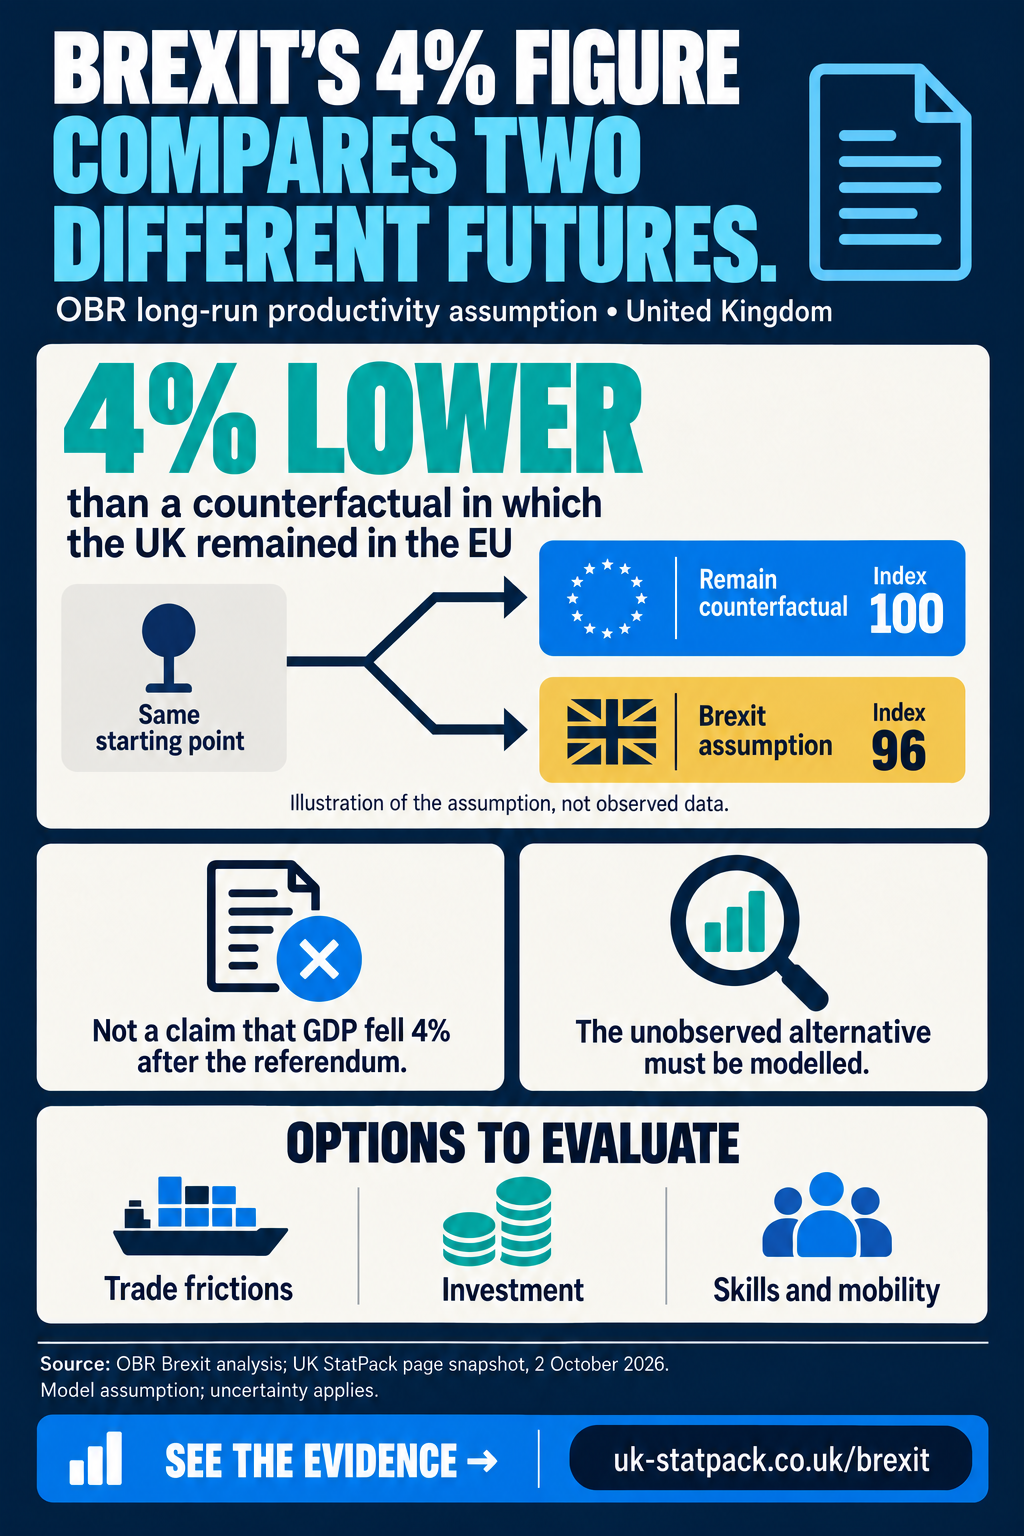
The OBR’s 4% compares two futures — it is not an observed fall.
The OBR assumes long-run productivity will be about 4% lower than if the UK had stayed in the EU. Index 100 against 96 illustrates that assumption; it is not GDP history.
Schematic: long-run productivity index (assumption, not data)
- Remain counterfactual100
- OBR assumption96
Illustrates the OBR assumption. No forecast path or confidence interval is implied.
Text and data version
The OBR’s 4% compares two futures — it is not an observed fall. The OBR assumes long-run productivity will be about 4% lower than if the UK had stayed in the EU. Index 100 against 96 illustrates that assumption; it is not GDP history.
| Measure | Value | Period | Geography | Type | Source |
|---|---|---|---|---|---|
| OBR assumption: long-run productivity relative to remaining in the EU | 4% lower | Long run (about 15 years from 2016) | United Kingdom | model assumption | OBR, Brexit analysis |
Image description: Brexit infographic: the OBR assumes long-run productivity about 4% lower than in a remain counterfactual — an assumption, not an observed fall.
Available images and their source records are listed on Shareable visuals.
Sources and methods (8)
- ONS, UK trade time series (MRET), chained volume measures, CDIDs JIM8, JIN3, JIM7, JIN2 (goods excluding precious metals); IKBE, IKBF (services) (released 11 September 2026) — goods and services trade volumes (BREXIT-02, BREXIT-03)
- ONS, Long-term international migration, provisional: year ending December 2025, Table 1 (released 21 May 2026) — net migration by nationality (BREXIT-04)
- ONS, Business investment, chained volume measure (NPEL), CDID NPEL, quarterly national accounts — business investment (BREXIT-05)
- Office for Budget Responsibility, Brexit analysis (released page last updated 20 July 2026) — long-run productivity and trade-intensity assumptions (modelled)
- Bloom, Bunn, Mizen, Smietanka, Thwaites and Abrahams, “The Economic Impact of Brexit”, NBER Working Paper 34459 (released November 2025, revised June 2026) — academic estimate of effects on GDP, investment, employment and productivity (modelled)
- Freeman, Manova, Prayer and Sampson, “UK trade in the wake of Brexit”, CEP Discussion Paper 1847 (LSE) (released April 2022) — academic estimate of the trade deal’s effect on UK–EU trade (modelled)
- UK Government, UK–EU Summit key documentation (Common Understanding, 19 May 2025; Joint Statement, 17 December 2025) — 2025 summit commitments and the December 2025 joint statement
- UK Government, Agreements reached between the UK and the EU (Trade and Cooperation Agreement, December 2020) — Trade and Cooperation Agreement text
Method notes
- Three kinds of evidence are kept separate: dated legal changes, observed official statistics, and modelled estimates relative to remaining in the EU. Modelled estimates are never drawn as observed lines.
- Trade is measured in volumes (chained volume measures), which remove price changes. Goods exclude precious metals. Indices use 2019, the last full year before both the pandemic and the end of the transition period, as the base.
- Migration uses ONS’s provisional long-term migration estimates, revised in every release; the 2016 values are ONS’s current back series, not the figures published at the time.
- The OBR and NBER estimates measure different things (long-run productivity versus GDP, investment and employment by 2025) and use different methods; they are presented side by side, not averaged.