Headline evidence · Tax options · United Kingdom · March 2026 forecast to 2030–31

The UK’s tax take is forecast to reach a historic high by 2030–31. Who pays?

Taxes are forecast to reach 38.5% of the economy in 2030–31. Explore how the burden falls on households and businesses—and what alternative tax choices could change. This is a national forecast, not your personal tax rate.

Proposed outcome: Compare how much taxes could raise, who would pay and how the economy could be affected. What could change →

Geography
United Kingdom
Evidence period
2030–31 · March 2026 forecast
Evidence status
Modelled projection
Editorial review
Reviewed 23 October 2026

The short version

How does the national tax take compare with its past?

Tax is forecast to reach 38.5% of the economy in 2030–31

The national tax take is not your personal tax rate. Solid lines show observed years; the dashed tail is the March 2026 forecast, not an outcome.

United Kingdom · 1948–49 to 2030–31; forecasts from 2026–27

1990–91 to 2030–31 · history window ends in 2025–26; five forecast years remain visible. Axis years show financial-year ends.

Taxes, % of the economy0%20%40%199520052015202538.5%Highest observed so far: 37.2%, 1948–49
The projected endpoint (38.5%) is above every observed value in this history; the highest so far is 37.2% in 1948–49, and the first forecast year to pass it is 2027–28. The series begins in 1948–49, so “historic” means in this record. OBR describes it as a historic high. Frozen thresholds and earnings growth increase income-tax receipts; National Insurance and capital taxes also contribute. The chart does not divide the increase into causal shares or show what individual families pay.

United Kingdom · 1948–49 to 2030–31; forecasts from 2026–27 · Outturn to 2025–26 (provisional); March 2026 forecast from 2026–27

A dated forecast, not a promise. The September 2026 databank retains March 2026 forecasts and updated outturn. No newer monthly figures are spliced into the history. GDP revisions and future Budgets can change the path.

Show the workings — Tax is forecast to reach 38.5% of the economy in 2030–31
Geography:
United Kingdom
Measure:
National Accounts taxes, % of GDP
Period:
1948–49 to 2030–31; forecasts from 2026–27
Status:
Outturn to 2025–26 (provisional); March 2026 forecast from 2026–27
Calculation:
Published annual tax-to-GDP percentages retained at source precision; display rounded to one decimal place. Financial-year ends on the horizontal axis.
Compare with:
All 78 observed years from 1948–49, followed by five forecast years.
Uncertainty:
A dated forecast, not a promise. The September 2026 databank retains March 2026 forecasts and updated outturn. No newer monthly figures are spliced into the history. GDP revisions and future Budgets can change the path.
Not included / breaks:
Taxes, not all public-sector receipts. Includes taxes on businesses and consumption, not just income tax. No household tax rate or GDP-per-person measure is inferred.

Source: OBR Public finances databank, September 2026, Aggregates (per cent of GDP): National account taxes. Forecast: March 2026 Economic and fiscal outlook (released 24 September 2026).

View the data as a table
Financial yearTaxes, % of GDPEvidence status
1948–4937.208Outturn
1949–5036.930Outturn
1950–5136.075Outturn
1951–5234.783Outturn
1952–5333.953Outturn
1953–5431.705Outturn
1954–5530.913Outturn
1955–5629.645Outturn
1956–5729.248Outturn
1957–5828.913Outturn
1958–5929.530Outturn
1959–6028.427Outturn
1960–6127.882Outturn
1961–6229.843Outturn
1962–6329.640Outturn
1963–6428.689Outturn
1964–6529.076Outturn
1965–6630.683Outturn
1966–6731.382Outturn
1967–6832.599Outturn
1968–6933.806Outturn
1969–7035.125Outturn
1970–7133.698Outturn
1971–7232.060Outturn
1972–7329.825Outturn
1973–7429.791Outturn
1974–7532.489Outturn
1975–7633.354Outturn
1976–7732.760Outturn
1977–7831.620Outturn
1978–7930.379Outturn
1979–8031.194Outturn
1980–8132.109Outturn
1981–8233.969Outturn
1982–8333.674Outturn
1983–8432.988Outturn
1984–8533.551Outturn
1985–8632.640Outturn
1986–8732.437Outturn
1987–8831.589Outturn
1988–8931.065Outturn
1989–9030.595Outturn
1990–9130.311Outturn
1991–9230.248Outturn
1992–9328.979Outturn
1993–9428.318Outturn
1994–9529.257Outturn
1995–9630.078Outturn
1996–9729.560Outturn
1997–9831.023Outturn
1998–9931.670Outturn
1999–0032.454Outturn
2000–0132.970Outturn
2001–0232.299Outturn
2002–0331.415Outturn
2003–0432.225Outturn
2004–0532.840Outturn
2005–0633.239Outturn
2006–0733.635Outturn
2007–0833.643Outturn
2008–0932.022Outturn
2009–1032.153Outturn
2010–1133.126Outturn
2011–1233.329Outturn
2012–1332.700Outturn
2013–1432.596Outturn
2014–1532.466Outturn
2015–1632.683Outturn
2016–1733.458Outturn
2017–1833.214Outturn
2018–1933.641Outturn
2019–2032.926Outturn
2020–2133.800Outturn
2021–2234.737Outturn
2022–2335.264Outturn
2023–2434.991Outturn
2024–2534.590Outturn
2025–2635.986Provisional outturn
2026–2736.996March 2026 forecast
2027–2837.722March 2026 forecast
2028–2937.846March 2026 forecast
2029–3038.289March 2026 forecast
2030–3138.462March 2026 forecast

Three key measures

Who pays, who gains

Broad taxes raise the most because almost everyone pays them; taxes on wealth reach few households because wealth is highly concentrated. Which is fairer is a value judgement this page does not make. What could be funded is a separate decision again: revenue raised is not earmarked, and turning money into shorter waiting lists or more homes needs staff, buildings and time that a revenue estimate does not show.

The evidence

Why bills rise without higher rates

When pay rises but tax thresholds stay fixed, more income becomes taxable or moves into a higher band. This is called fiscal drag. A pay rise that only keeps pace with prices can still leave a larger share of pay going in tax.

The standard personal allowance is £12,570 in 2026–27. Current policy freezes it until April 2031. Higher-rate thresholds are also frozen, but Scotland sets different bands for non-savings, non-dividend income. Pension income can also be taxable. The impact depends on your income and circumstances—not the national 38.5% figure.

Current income-tax allowances and bands · OBR March 2026, paragraphs 3.2 and 3.8–3.11

Who pays now?

Which taxes provide the money now?

Income tax, National Insurance and VAT provide most tax revenue

Revenue by tax, not a breakdown of which households ultimately bear the cost. These figures include employer National Insurance.

United Kingdom · 2025–26, provisional
  • Income tax£329.3bn
  • National Insurance · employers and individuals£204.4bn
  • VAT · net of VAT refunds£180.3bn
  • All other National Accounts taxes, including VAT refunds£390.6bn
The tax name does not identify the ultimate payer. Employers can pass some National Insurance costs into wages, prices or profits; VAT treatment varies by what people buy. A matched household distribution study is needed to quantify winners and losers.

United Kingdom · 2025–26, provisional · Provisional outturn

Show the workings — Income tax, National Insurance and VAT provide most tax revenue
Geography:
United Kingdom
Measure:
£ billion, cash
Period:
2025–26, provisional
Status:
Provisional outturn
Calculation:
Income-tax columns summed. Other taxes are the residual against National Accounts taxes; VAT refunds are in that residual, not counted twice.
Compare with:
Total National Accounts taxes: £1104.7bn.

Source: OBR Public finances databank, September 2026, Receipts (£bn): income tax (PAYE + self assessed + other), NICs, VAT net of refunds, National accounts taxes (released 24 September 2026).

View the data as a table
Tax£bn, cash
Income tax329.338
National Insurance · employers and individuals204.429
VAT · net of VAT refunds180.326
All other National Accounts taxes, including VAT refunds390.593

Workers and pensioners pay income tax; consumers pay VAT on taxable purchases; employers and individuals pay National Insurance. Businesses and asset owners also pay taxes. But who sends the payment is not always who bears the cost: businesses can pass some costs into prices, wages or profits.

To judge an alternative, ask what a household would gain or lose, including changes in benefits and services. These national totals cannot tell us whether a particular family is better off. The options below identify likely payers; they are not a complete household-impact model.

Survey-based evidence

No clear public consensus on higher or lower taxes and spending

The three main answers were almost level in October 2026. This is a choice about taxes and services together—not support for any particular tax, a ranking of people’s biggest concerns or a vote on a costed plan.

% of respondents, Great Britain adults 18+
  • Increase taxes and spending26%
  • Decrease taxes and spending26%
  • Keep both about the same27%
  • Don’t know21%
Question, sample and source

YouGov, commissioned by YouGov; published 21 October 2026. Online fieldwork 8–9 October 2026, Great Britain adults aged 18+; total survey sample 2,079. The first question’s table reports an unweighted base of 2,030 and a rebased weighted base of 2,021. Published weighted whole percentages are retained; no question-specific confidence intervals are supplied here.

Question: “Now thinking about spending on public services and the taxes that fund them, which of the following best reflects your view?” Answers: increase taxes and spend more; decrease taxes and spend less; keep taxes and spending about the same; don’t know.

Online panel estimates can be affected by selection, non-response and weighting. These results are separate from the British Social Attitudes series below: different questions, samples and methods must not be joined as one trend. Small differences do not establish a meaningful lead.

Original YouGov tables, page 1 · Publisher’s report and method

What the alternatives could raise

These are separate designs, not one package or a list of free money. HMRC’s June 2025 ready-reckoner assumes changes from April 2026 on a Spring Statement 2025 baseline. Later Budgets changed that baseline: keep these dated illustrations separate from the March 2026 forecast above. No newer ready-reckoner edition was listed when checked on 23 October 2026.

What could each option raise under a specified design?

Broad taxes can raise billions; an older estimate suggests a large capital gains tax rise could lose money

United Kingdom · Rate changes: 2027–28 for a change made in April 2026. Compliance: 2029–30. Wealth Tax Commission: 2020 study.

Collect tax already due (a year)

  • Compliance and debt package (Autumn Budget 2024, extended since)Annual, by 2029–30; already in the forecasts£10.0bn
  • Further compliance beyond the packageNo robust estimate: the tax gap is not a measure of what more enforcement would collect

Change rates or bases — HMRC ready-reckoner, 2027–28 (a year, each change on its own)

  • Employer National Insurance +1 percentage point£11.3bn
  • VAT standard rate +1 percentage point£9.2bn
  • Income tax basic rate +1p£8.3bn
  • Employee National Insurance main rate +1 percentage point£5.3bn
  • Corporation tax main rate +1 percentage point£3.9bn
  • Income tax higher rate +1p£2.1bn
  • Income tax additional rate +1p£0.27bn
  • Inheritance tax standard rate +1 percentage point£0.24bn
  • Capital gains tax higher rate +10 percentage pointsLoses money: sales are delayed or avoided£-2.1bn

Property and wealth (a year)

  • Annual wealth tax, 0.6% above £2m (Wealth Tax Commission illustration)Per year after administration costs; 2020 study, not an official costing£10.0bn
  • Annual wealth tax, 2% above £10mNo robust estimate: no primary costing found (an earlier “£17bn” is withdrawn)
  • Council tax revaluation or reformNo official yield: depends entirely on design; many proposals are revenue-neutral

One-off receipts (total, not a year)

  • One-off wealth tax, 1% a year for five years above £500,000 (Wealth Tax Commission)Total over five years, not per year£260.0bn

Small changes to widely paid taxes can raise large sums. Higher taxes on asset sales can bring in less if people delay selling. These estimates cannot simply be added together.

United Kingdom · Rate changes: 2027–28 for a change made in April 2026. Compliance: 2029–30. Wealth Tax Commission: 2020 study. · HMRC illustrative economic modelling (OSR questioned the official-statistics label in December 2025); the compliance yield is a government costing; Wealth Tax Commission figures are independent research

Show the workings — Broad taxes can raise billions; an older estimate suggests a large capital gains tax rise could lose money

Estimated additional revenue for specific designs, grouped by kind. Rate and base changes: HMRC ready-reckoner, 2027–28, £bn cash. Each row is a separate illustrative change, not additive, and scales differ between groups.

A point on a broad base — employer National Insurance, VAT or the basic rate of income tax — raises £8–11bn a year. Narrower taxes on the wealthiest raise far less per point, and the HMRC estimate for a 10-point rise in the higher capital gains rate is negative, because people delay or avoid selling assets. No range is published for these figures, so none is shown. Rows cannot be added: several changes would interact.

Geography:
United Kingdom
Measure:
£ billion a year (one-off group: £ billion total)
Period:
Rate changes: 2027–28 for a change made in April 2026. Compliance: 2029–30. Wealth Tax Commission: 2020 study.
Status:
HMRC illustrative economic modelling (OSR questioned the official-statistics label in December 2025); the compliance yield is a government costing; Wealth Tax Commission figures are independent research
Calculation:
HMRC £ million converted to £ billion. No adjustment for overlap; no group total.
Compare with:
Total public sector receipts £1,231.3bn in 2025–26
Not included / breaks:
June 2025 ready-reckoner uses the Spring Statement 2025 baseline and an April 2026 implementation; these are not newly costed October 2026 policies. Figures are direct effects of small changes and include some behavioural response; large changes cause proportionately larger responses. Pension fund investment is excluded: it is financing capital, not tax revenue. The Energy Profits Levy and Digital Services Tax are excluded because their receipts are already in the forecasts.

Source: HMRC, Direct effects of illustrative tax changes (June 2025) (released 24 June 2025).

View the data as a table
GroupDesignEstimateBasis
Collect tax already dueCompliance and debt package (Autumn Budget 2024, extended since)£10.0bnAnnual, by 2029–30; already in the forecasts
Collect tax already dueFurther compliance beyond the packageNo robust estimate
Change rates or basesEmployer National Insurance +1 percentage point£11.25bn2027–28, HMRC ready-reckoner
Change rates or basesVAT standard rate +1 percentage point£9.20bn2027–28, HMRC ready-reckoner
Change rates or basesIncome tax basic rate +1p£8.25bn2027–28, HMRC ready-reckoner
Change rates or basesEmployee National Insurance main rate +1 percentage point£5.30bn2027–28, HMRC ready-reckoner
Change rates or basesCorporation tax main rate +1 percentage point£3.90bn2027–28, HMRC ready-reckoner
Change rates or basesIncome tax higher rate +1p£2.15bn2027–28, HMRC ready-reckoner
Change rates or basesIncome tax additional rate +1p£0.27bn2027–28, HMRC ready-reckoner
Change rates or basesInheritance tax standard rate +1 percentage point£0.24bn2027–28, HMRC ready-reckoner
Change rates or basesCapital gains tax higher rate +10 percentage points£-2.06bn2027–28, HMRC ready-reckoner
Property and wealthAnnual wealth tax, 0.6% above £2m (Wealth Tax Commission illustration)£10.0bnPer year after administration costs; 2020 study, not an official costing
Property and wealthAnnual wealth tax, 2% above £10mNo robust estimate
Property and wealthCouncil tax revaluation or reformNo robust estimate
One-off receiptsOne-off wealth tax, 1% a year for five years above £500,000 (Wealth Tax Commission)£260bn totalTotal over five years, not per year

Scroll the table sideways to see every column.
The tax base over time, and the choices people favour

Annual data: Public-sector receipts over time

Years identify financial-year ends: 2026 means April 2025 to March 2026. The fixed 1996–2026 window contains published outturns, with the latest provisional. Forecasts are excluded. GDP ratios provide historical scale; they are not a counterfactual for any proposed tax package. A dash means no comparable observation is supplied; it is not zero. UK public-sector current receipts, including tax and non-tax revenue; this is not a measure of how much an additional tax change would raise.

1996–2026; % of GDP. No change is calculated across definition or assessment breaks.

Public-sector receipts over time; % of GDP
YearReceipts, % GDP
199633.1
199732.3
199834.4
199935
200035.7
200136.4
200235.6
200334.5
200435.3
200535.9
200636.5
200736.9
200837.2
200935.7
201035.8
201136.8
201237.1
201336.7
201436.6
201536.5
201636.7
201737.3
201836.9
201937.2
202036.6
202137.6
202238.4
202339.3
202439.3
202538.9
202640.1

OBR September 2026 databank and its original workbooks

Keeping tax and spending unchanged was the most common answer

British Social Attitudes 2025, released February 2026. Respondents chose between reducing, maintaining or increasing taxes and spending on health, education and social benefits. These are broad preferences, not a vote on a costed budget or evidence that a particular tax would raise enough money.

Published share of respondents, %
  • Keep taxes and spending the same41%
  • Increase taxes and spending36%
  • Reduce taxes and spending19%
Survey sample, question and uncertainty

NatCen’s Appendix Table 1 gives an unweighted question base of 4,727. The 2025 survey sampled UK private-household residents aged 16 and over through randomly selected postal addresses, inviting up to two people per household to respond online or by phone. Fieldwork ran from 26 August to 5 October 2025. Institutions were excluded; people within households were not selected by a strict individual randomisation procedure. Weighting addresses selection and response differences.

The technical report estimates a 16.6% adjusted household response rate and an 11.7% adjusted individual response rate. The first-look table does not publish question-specific confidence intervals or identify a restricted GB-only weight, so none is invented here. The methods also supply a GB 18+ comparison weight; the current sample and the older population are not treated as interchangeable.

The published whole percentages are shown unchanged: the three choices total 96%; “don’t know” and “prefer not to answer” are each 1%, giving 98% across the displayed source categories. They are not rebalanced to 100%. This does not establish a majority for either higher spending or cuts. The survey moved from face-to-face to online/phone in 2020 and expanded from GB 18+ to UK 16+ in 2024.

NatCen question and Appendix Table 1 · 2025 technical methods

Annual data: Preference for higher tax and spending

Thirty published observations, 1996–2025, inside the fixed 1996–2026 window. No 2026 wave is available. Columns separate the 2020 mode and 2024 population changes. No percentage-point movement across either break or statistical significance is inferred. Other answers are shown for the latest wave above; this is not an exhaustive opinion distribution. A dash means no comparable observation is supplied; it is not zero. Separate survey waves and samples, not the same people followed over time. Unweighted question bases vary by year.

1996–2026; published whole percentage. No change is calculated across definition or assessment breaks.

Preference for higher tax and spending; published whole percentage
YearGB 18+, face-to-faceGB 18+, online/phoneExpanded UK 16+ sample
199659——
199762——
199863——
199958——
200050——
200159——
200263——
200351——
200449——
200546——
200646——
200742——
200839——
200934——
201031——
201136——
201234——
201336——
201437——
201545——
201648——
201760——
201857——
201953——
2020—50—
2021—52—
2022—55—
2023—46—
2024——40
2025——36
2026No comparable observations supplied

Chapter 1

Collect more of the tax already due

HMRC’s tax gap is the difference between the tax that should in theory be paid and what is paid. Most of it is not deliberate: HMRC’s illustrative split puts the largest parts down to failure to take reasonable care and error, with disputed legal interpretation and non-payment (including insolvency) close behind. That is why the gap is not a pot that enforcement can empty.

Why is most of the tax gap hard to collect?

Most unpaid tax comes from carelessness and error, not evasion

United Kingdom · 2024–25 (around two-thirds of the total projected)
  • Failure to take reasonable care£20.8bn
  • Error£9.3bn
  • Evasion£7.1bn
  • Legal interpretationDisputes over what the law requires£6.9bn
  • Non-paymentIncludes insolvency£5.7bn
  • Criminal attacks£5.0bn
  • Hidden economy£3.6bn
  • Avoidance£0.8bn

Not all unpaid tax is deliberate evasion. Mistakes, disputes and businesses unable to pay need different responses. Some money cannot realistically be recovered.

United Kingdom · 2024–25 (around two-thirds of the total projected) · Illustrative: HMRC labels this split as less certain than the estimates by type of tax

Show the workings — Most unpaid tax comes from carelessness and error, not evasion

HMRC illustrative tax gap by behaviour, 2024–25, £bn. Total £59.2bn.

Evasion, avoidance and criminal attacks together are about 22% of the gap. The rest — carelessness, error, legal disputes, non-payment and the hidden economy — needs different tools: better guidance and record-keeping, clearer law, debt collection. Some, such as tax lost in insolvencies, is largely unrecoverable. Any claim to “close the gap” should say which part it targets.

Geography:
United Kingdom
Measure:
£ billion
Period:
2024–25 (around two-thirds of the total projected)
Status:
Illustrative: HMRC labels this split as less certain than the estimates by type of tax
Calculation:
As published.
Compare with:
Total tax gap £59.2bn
Not included / breaks:
Behaviours are HMRC classifications and overlap at the margins.

Source: HMRC, Measuring tax gaps 2026 edition, 1. Tax gaps: summary (estimates for the 2024 to 2025 tax year), Table 7.1 (released 23 June 2026).

View the data as a table
Behaviour£bn
Failure to take reasonable care20.8
Error9.3
Evasion7.1
Legal interpretation6.9
Non-payment5.7
Criminal attacks5.0
Hidden economy3.6
Avoidance0.8

HMRC compliance and debt collection (closing part of the tax gap)

£10bn a year by 2029–30

Government total for the compliance and debt package begun at Autumn Budget 2024 (£6.5bn of it) and extended at later fiscal events, as stated by HMRC in its 2026–27 quarter 1 performance update

Design, overlaps and delivery constraints
Recurring or one-off:
Recurring, building up to 2029–30. Already announced, so already in the fiscal forecasts.
What is costed:
The package recruits 5,500 new compliance caseworkers, retains about 1,200 debt-management staff and recruits 1,200 more, alongside other measures set out at Autumn Budget 2024 and later fiscal events.
Context:
HMRC estimates the total tax gap at £59.2bn in 2024–25 (6.4% of theoretical liabilities). The Corporation Tax gap is £21.0bn (18.1% of liability): £17.3bn small businesses, £1.5bn mid-sized, £2.3bn large. The tax gap is an estimate of tax not paid, not a sum that can be collected: it includes insolvency, error and legal interpretation.
Overlaps:
Any further “close the tax gap” yield overlaps with this package. The large-business share of the Corporation Tax gap (£2.3bn) also overlaps with the multinational option.
Delivery constraints:
Yield depends on recruiting and training the additional staff, so it builds up over several years.

Sources: HM Revenue and Customs, HMRC performance update: 2026 to 2027 quarter 1 (13 August 2026); HM Treasury, Autumn Budget 2024 (HC 295) (30 October 2024); HMRC, Measuring tax gaps 2026 edition, 1. Tax gaps: summary (estimates for the 2024 to 2025 tax year) (23 June 2026)

What specific avoidance looks like in practice: Tax Policy Associates has documented individual schemes, for example one fragmenting a workforce across thousands of shell companies to claim small-business reliefs. These are illustrations, not a share of the national total. Tax Policy Associates.

Chapter 2

Change rates, bases or reliefs

The most reliable revenue comes from small changes to the biggest taxes, because their bases are large and taxpayers respond only modestly. A new wealth tax counts as a tax change too, even if no existing headline rate moves. Taxes already in place — the Energy Profits Levy and the Digital Services Tax — are already in the forecasts, so their receipts are not new money.

Taxing large multinational digital businesses

No official costing of further measures

The existing Digital Services Tax raised £944m in 2025–26

Design, overlaps and delivery constraints
Recurring or one-off:
Recurring. The DST is already in place, so its receipts are already in the forecasts.
What is costed:
The 2% Digital Services Tax raised £380m in 2021–22, £567m in 2022–23, £678m in 2023–24, £808m in 2024–25 and £944m in 2025–26. The government describes it as an interim measure it will remove once a global agreement on taxing rights is in place.
Context:
No primary source was found that costs a specific further measure aimed at profit shifting by large technology companies.
Overlaps:
Overlaps with the large-business share of the Corporation Tax gap and with HMRC compliance work.
Delivery constraints:
Depends on international agreement.

Sources: HM Treasury/HMRC, Digital Services Tax review report (26 November 2025); HMRC, Tax and NICs receipts for the UK: statistics table (Digital Services Tax) (22 September 2026)

Energy Profits Levy (North Sea windfall tax)

£8.5bn in total, 2025–26 to 2030–31

OBR forecast at the Autumn Budget 2025 for the levy as legislated

Design, overlaps and delivery constraints
Recurring or one-off:
Recurring until the levy ends (31 March 2030, or earlier if prices fall below the Energy Security Investment Mechanism thresholds for six months). Already in the forecast.
What is costed:
The levy has raised more than £11bn since it was introduced in May 2022 (HM Treasury, December 2025).
Context:
Because the levy already exists, its receipts are not new money. Only a higher rate or a later end date would raise more, and no official costing of either was found.
Overlaps:
Charged on the same ring-fenced profits as North Sea Corporation Tax and the Supplementary Charge.
Delivery constraints:
Receipts depend on oil and gas prices and on North Sea production and investment.

Sources: HM Treasury, written answer to UIN 93531 (Energy Profits Levy) (answered 1 December 2025); OBR, Oil and gas revenues (November 2025 Economic and fiscal outlook) (November 2025)

Chapter 3

Reform property and wealth taxation

Wealth is taxed today mainly when it changes hands — capital gains tax on sales, inheritance tax on death, stamp duty on property — and through council tax, still based on 1991 values in England. Each route has a different evidence base. HMRC’s estimates show that raising capital gains rates sharply can reduce revenue; the Wealth Tax Commission’s figures for an annual tax are independent research, not an official costing.

Annual wealth tax

No official costing

No HMRC or OBR costing of an annual UK wealth tax was found

Design, overlaps and delivery constraints
Recurring or one-off:
An annual tax would be recurring. The Wealth Tax Commission’s preferred design was one-off.
What is costed:
The Wealth Tax Commission recommended against an annual wealth tax and in favour of reforming existing taxes on wealth. As an illustration, an annual 0.6% tax on wealth above £2m could raise £10bn a year after administrative costs; evidence from other countries suggests 7–17% of the base would be lost to avoidance at a 1% rate. Its preferred one-off tax (1% a year for five years above £500,000 per person) could raise £260bn in total.
Context:
A new wealth tax would be a tax change even though existing headline rates would not change. The £260bn is a one-off total over five years, not an annual yield.
Overlaps:
Interacts with Capital Gains Tax and Inheritance Tax, which already tax the same wealth when sold or passed on.
Delivery constraints:
Regular valuation, liquidity problems for asset-rich, cash-poor payers, and behavioural responses; a new administrative system would be needed.

Source: Wealth Tax Commission, A wealth tax for the UK: final report (9 December 2020)

Chapter 4

Ownership and asset options

Public ownership changes who receives a company’s profits; it does not create tax revenue, and it requires buying the company and taking on its debt. Pension fund investment is different again: steering private pension savings towards UK assets is a question of financing capital, not Exchequer revenue, so it is not on this page’s yield chart (see pensions).

Rail passenger services in public ownership

Up to £150m a year in fees

Department for Transport estimate of fees no longer paid to private operators

Design, overlaps and delivery constraints
Recurring or one-off:
Recurring saving, not new tax revenue. Current policy, implemented as contracts expire.
What is costed:
Operators transfer to public ownership under the Passenger Railway Services (Public Ownership) Act 2024 as their contracts end.
Context:
A saving on fees, not a reclaim of past profits, and already government policy.
Overlaps:
None of the tax options.
Delivery constraints:
Savings arrive only as each contract expires.

Source: Department for Transport, First train services to return to public ownership revealed (4 December 2024)

Water companies in public ownership

Not a revenue measure; no official costing

Dividends are private payments to shareholders, not lost tax

Design, overlaps and delivery constraints
Recurring or one-off:
One-off cost to acquire, with recurring effects either way.
What is costed:
Companies in England and Wales declared £1.0bn of dividends for 2023–24 and £0.645bn for 2024–25. Sector net debt was £76.3bn at 31 March 2025 (Ofwat).
Context:
Public ownership would mean compensating shareholders and taking on or refinancing the companies’ debt. The net effect depends on the price paid and the cost of borrowing — set out with adjustable assumptions in the model.
Overlaps:
None of the tax options.
Delivery constraints:
Requires legislation and a valuation of the companies.

Source: Ofwat, Monitoring financial resilience report 2024-25 (November 2025)

Chapter 5

Revenue range, timing and overlap

Nothing on this page should be added up. The compliance package, the Energy Profits Levy and the Digital Services Tax are already in the forecasts; compliance yield and any multinational measure draw on the same Corporation Tax gap; capital gains and inheritance tax changes interact with any wealth tax; and one-off totals cannot be set against yearly flows.

What has to happen before money arrives?

Broad rate changes can raise money within a year; new wealth and property taxes need new systems first

United Kingdom (council tax: England) · As of October 2026
OptionLegislationAdministrationTaxpayer responseFirst receiptsWho paysUncertainty
Compliance packageMostly not requiredFunded: 5,500 compliance caseworkers and about 2,400 debt postsSome shifting to harder-to-detect non-complianceBuilds from 2025–26Non-compliant taxpayers, mostly small businessesModerate: depends on recruitment
Broad rate rise (income tax, NICs, VAT)Required: Finance ActExisting systemsModest; included in HMRC figuresNext tax yearBroad: most workers or consumersLow for small changes
Capital gains or inheritance tax changesRequired: Finance ActExisting systemsLarge: timing of sales and giftsOne to two years (paid after disposals)Concentrated on wealthier householdsHigh: yields can turn negative
Annual wealth taxRequired: new taxRequired: new valuation systemLarge: 7–17% of the base lost at a 1% rate (Commission’s evidence)Several yearsRichest householdsHigh: no official costing
Council tax revaluationRequiredRequired: revaluation of every home (England last valued 1991)LimitedSeveral yearsDepends on design; shifts bills between areas and homesUnknown: no official costing

Changing an existing tax is usually quicker than creating a new one. Taxes needing fresh property or wealth valuations take longer to set up. Speed alone does not decide what is fair.

United Kingdom (council tax: England) · As of October 2026 · Editorial assessment, sourced

Show the workings — Broad rate changes can raise money within a year; new wealth and property taxes need new systems first

Qualitative delivery requirements for each kind of option. Text states, not scores.

The quickest, most certain money comes from small changes to big existing taxes, because the systems exist and the behavioural response is modest. Options aimed at the wealthiest are slower and less certain: they need valuations, new administration, or face large behavioural responses. That is a statement about delivery, not about which option is fairer or more desirable — a separate value judgement.

Geography:
United Kingdom (council tax: England)
Measure:
Not quantitative
Period:
As of October 2026
Status:
Editorial assessment, sourced
Calculation:
UK Facts summary of the sources listed for each option on this page.

Source: Wealth Tax Commission, A wealth tax for the UK: final report (released 9 December 2020).

View the data as a table
OptionLegislationAdministrationTaxpayer responseFirst receiptsCostWho paysUncertainty
Compliance packageMostly not requiredFunded: 5,500 compliance caseworkers and about 2,400 debt postsSome shifting to harder-to-detect non-complianceBuilds from 2025–26Netted off in the costingNon-compliant taxpayers, mostly small businessesModerate: depends on recruitment
Broad rate rise (income tax, NICs, VAT)Required: Finance ActExisting systemsModest; included in HMRC figuresNext tax yearLowBroad: most workers or consumersLow for small changes
Capital gains or inheritance tax changesRequired: Finance ActExisting systemsLarge: timing of sales and giftsOne to two years (paid after disposals)LowConcentrated on wealthier householdsHigh: yields can turn negative
Annual wealth taxRequired: new taxRequired: new valuation systemLarge: 7–17% of the base lost at a 1% rate (Commission’s evidence)Several yearsMaterial; netted off in the Commission’s £10bn illustrationRichest householdsHigh: no official costing
Council tax revaluationRequiredRequired: revaluation of every home (England last valued 1991)LimitedSeveral yearsRevaluation cost unknownDepends on design; shifts bills between areas and homesUnknown: no official costing

Scroll the table sideways to see every column.

Corrections & changes: withdrawn estimates
  • HMRC compliance and debt collection (closing part of the tax gap): A bar showing the whole ~£21bn Corporation Tax gap as an “opportunity” was removed: the gap measures non-payment, not a costed yield.
  • Taxing large multinational digital businesses: A “£2–4bn a year” estimate was removed: no primary source was found for it.
  • Energy Profits Levy (North Sea windfall tax): A claim that a “sustained” windfall tax could raise £5–10bn a year, and an £11.6bn operator-profit figure, were removed: neither had a primary source.
  • Annual wealth tax: A “£17bn” mid-point for a 2% tax above £10m, attributed to the Commission, IPPR and Warwick, was removed: the Commission did not publish it and no primary costing was found.
  • Rail passenger services in public ownership: A “~£500m a year” operator-profit figure was removed: no primary source.
  • Water companies in public ownership: A “£2.4bn” dividend figure shown as annual revenue was removed: dividends are not revenue the government could collect.

Why it is happening

Our analysis

Tax changes affect how people work, invest and sell assets. The amount raised depends on those responses and how the rules work, not just the rate announced.

Read the options, evidence and limits below.

Who is affected most

Chapter 6

Who pays, who gains — and what could be funded?

Survey-based evidence
ONS Wealth and Assets SurveySurvey-based wealth estimate; coverage and valuation limits apply.

Who would a wealth tax fall on?

The richest tenth of households hold 41% of household wealth; the poorer half hold 10%

Great Britain · 2020–22
2020–22
  • Richest tenth of households40.7%
  • Poorer half of households9.8%

The richest tenth hold much more wealth than the poorer half combined. That does not tell us how much a new tax would collect. Earlier figures use a different pension valuation method.

Great Britain · 2020–22 · Official survey estimates; accreditation suspended from Round 8 (2020–22) in June 2025

Show the workings — The richest tenth of households hold 41% of household wealth; the poorer half hold 10%

Share of total household wealth (property, pensions, financial and physical), Great Britain, 2020–22.

Wealth is far more concentrated than income, so taxes on wealth fall on a small number of households and their yield depends on how those households respond. The latest distribution is shown on its own: the stored preceding wave uses a different pension-valuation method, so its apparent change cannot be interpreted as a fall in concentration. Wealth holdings do not directly identify a taxable base or a collectable yield.

Geography:
Great Britain — Private households
Measure:
% of total household wealth
Period:
2020–22
Status:
Official survey estimates; accreditation suspended from Round 8 (2020–22) in June 2025
Calculation:
Wealth held by each group divided by total household wealth, from stored ONS series.
Not included / breaks:
Survey-based: the very wealthiest are under-represented. Pandemic telephone collection and non-response increased uncertainty. Pension-valuation methods changed in Round 8; older stored totals are not a comparable trend. Pension wealth is not readily available cash. No question-specific confidence interval is supplied here.

Source: ONS, Household total wealth in Great Britain: April 2020 to March 2022.

View the data as a table
Group2020–22
Richest tenth of households40.7%
Poorer half of households9.8%

What could change

Proposals to consider. The bodies named below would need to agree to deliver them; responsibility is not a recorded commitment. Follow the links for costs and evidence.

  • Close capital-tax reliefs rather than raise rates

    Examine removing tax breaks on capital instead of raising tax rates.

    Who could deliver it: Treasury, the tax authority and Parliament.

    Main trade-off and delivery needs

    Forestalling, avoidance and investment effects; progressivity must be demonstrated.

    Name reliefs, thresholds, interactions and transition; obtain distributional/behavioural costing and administrative assessment.

    Cost: The extra cost is not yet known.

    Costs, drawbacks and evidence →
  • Property and land tax reform

    Examine changes to taxes on property and land.

    Who could deliver it: Treasury, valuation bodies and relevant governments.

    Main trade-off and delivery needs

    Concentrated losers and valuation disputes; revenue-neutral change funds no extra spending.

    Separate council-tax revaluation, land/property tax and transaction-tax changes; model losers and deferral options.

    Cost: The extra cost is not yet known.

    Costs, drawbacks and evidence →
  • A tax on the very top fortunes: three designs

    Compare three possible designs for a tax on the largest fortunes.

    Who could deliver it: Treasury, the tax authority and Parliament.

    Main trade-off and delivery needs

    Valuation/staff constraints; emigration, avoidance, liquidity and legal risk.

    Separate annual wealth tax, minimum effective tax and one-off levy; define base, residence, valuation and anti-avoidance.

    Cost: The extra cost is not yet known.

    Costs, drawbacks and evidence →
  • Collect the tax already due

    Improve collection of tax that is already owed.

    Who could deliver it: the tax authority and Treasury.

    Main trade-off and delivery needs

    Due-process burdens; yield lags and double counting existing forecasts.

    Reconcile existing forecast baseline; define cases, staff, legal powers and collection horizon; audit net additional receipts.

    Cost: The extra cost is not yet known.

    Costs, drawbacks and evidence →

See all options and what is still unknown →

Some problems have no assessed solution yet: see coverage and gaps.

Domain SWOT

Recorded

Show the findings
Strengths · 2 findings
  • Official costings exist for specific changes: HMRC’s ready reckoner puts +1p on the basic rate of income tax at about £8.25bn a year in 2027–28.

    United Kingdom · 2027–28 (June 2025 ready reckoner)

  • Detailed household-level modelling of property-tax reform is published: the IFS modelled council-tax revaluation and reform for every income group and council.

    England · 2020 (property values at Q1 2019)

Weaknesses · 3 findings
  • Estimates rest on different years, baselines and behaviour: HMRC’s lines are single small changes, the IFS tax options predate Budget 2025, and the IFS council-tax modelling uses 2019 values — so they cannot be added together.

    our synthesis

  • Council tax bands in England still rest on April 1991 values, and the top band pays three times the bottom band although those homes were worth at least eight times as much in 1991.

    England · Valuation base April 1991 (still in use; IFS 2020 and June 2024)

  • Reliefs narrow the capital taxes: business asset disposal relief cost about £1.0bn in 2023–24 and agricultural and business property relief about £1.9bn in 2022–23, while gains held at death are not taxed and HMRC does not estimate their cost. The OBR expects behaviour to remove about 60% of the static yield of the 2024 capital gains tax rate rises.

    United Kingdom · 2022–23 to 2025–26 (relief costs); October 2024 (OBR costing)

    Budget 2026 responds to this

    The business asset disposal relief lifetime limit is cut to £500,000 from April 2027.

    Business Asset Disposal Relief (BADR)

Opportunities · 1 finding
  • Comparing a broad-tax package, a compliance package and a revenue-neutral property-tax reform on one baseline would show real choices — and that the property reform redistributes rather than raises money.

    Depends on: Packages are presented as alternatives on one price year, and each receipt funds one use only.

    our synthesis

Threats · 3 findings
  • Revenue illustrations can look more certain than their evidence: OSR questioned the ready-reckoner’s official-statistics label and requested clearer modelling uncertainty. Wealth-survey accreditation is suspended from 2020–22 and pension valuation changed, limiting comparisons and precise tax-base estimates.

    risk

  • Behaviour can wipe out simple yields: on HMRC’s figures, +10 points on the higher rate of capital gains tax loses about £2.06bn, while +1 point on inheritance tax raises about £0.24bn.

    risk

  • Property-tax reform creates concentrated losers: in the IFS modelling about 17% of London’s poorest fifth would pay over £200 a year more, which makes transition relief and deferral necessary and costly.

    risk

See the whole-UK SWOT →

Domain action plan

Proposed

Possible steps for government and the bodies responsible. These describe the order of work, not promised dates: starting an action and seeing results take different amounts of time.

  1. Short term · prepare

    Check how each proposal would work and who would pay.

  2. Medium term · deliver

    Test administration, behaviour changes and realistic collection costs.

  3. Long term · judge results

    Compare money actually raised with the estimate and wider effects.

Delivery steps and owners (5)
  1. Prerequisite: Fix one post-Budget baseline and price year for all packages · HM Treasury and HMRC (or independent modellers) · proposed
  2. Decision: Choose one package and legislate · HM Treasury; Parliament (Finance Act) · proposed
  3. Delivery: High Value Council Tax Surcharge starts: targeted valuation of homes worth £2m+ · Valuation Office Agency; councils collect for central government · April 2028
  4. Result: Net receipts against costing; incidence by household · HMRC; OBR · proposed
  5. Prerequisite: Publish official costings of closing specific capital-tax reliefs, with behavioural assumptions · HMRC and the OBR · proposed

Sources, method and changes

Shareable visual summary

Visual summary

Editorial explainer

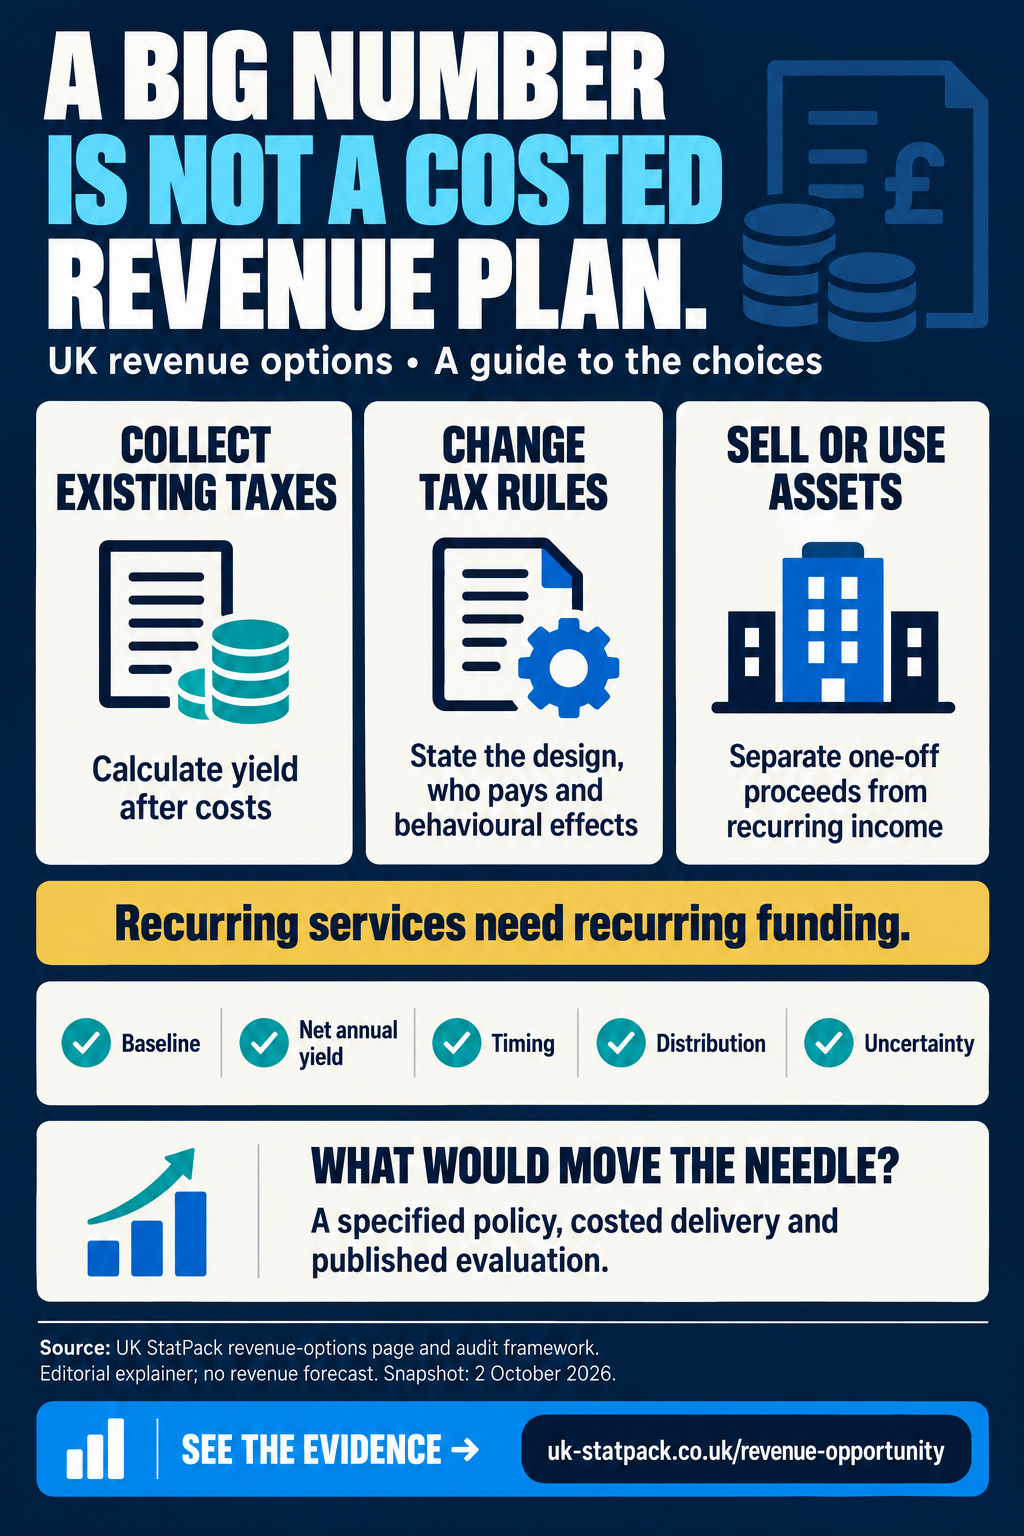
A big number is not a costed revenue plan.

Collecting existing taxes, changing tax rules and selling assets need different costings. One-off proceeds and recurring revenue are different things.

How to read it

  1. Step 1Collect what is owed
  2. Step 2Change the rules
  3. Step 3Sell or lease assets
  4. Step 4Cost each separately

Editorial explainer: no statistic is shown.

Editorial explainer. No statistic is shown.
Download image (PNG, 1024 by 1536 pixels)

A big number is not a costed revenue plan.

A big number is not a costed revenue plan — editorial explainer from UK Facts.
Text and data version

A big number is not a costed revenue plan. Collecting existing taxes, changing tax rules and selling assets need different costings. One-off proceeds and recurring revenue are different things.

Editorial explainer: no statistic is shown.

Image description: A big number is not a costed revenue plan — editorial explainer from UK Facts.

Available images and their source records are listed on Shareable visuals.

Sources and methods (16)

Method notes

  • No figures on this page are added together. Several options overlap or interact, some are already in the forecasts, and some are one-off totals.
  • HMRC ready-reckoner figures are for small illustrative changes in isolation; large or combined changes need a full costing.
  • Recurring yields (a year) and one-off sums (a total) are shown in separate groups with different scales.
  • This page covers revenue. Spending choices are compared on the public finances page.