Headline evidence · Jobs & pay · UK · people aged 16–64 · June to August 2026
2.7 million working-age people are out of work through long-term sickness, 658,000 more than at the end of 2019.
About 2.7 million people of working age are not working and not looking for work because of long-term illness, 658,000 more than at the end of 2019. The overall share outside the labour market has barely moved. Unemployment is a smaller, separate group.
Proposed outcome: Help people find suitable, lasting work and better pay, with extra support for young people. What could change →
- Geography
- United Kingdom
- Evidence period
- June to August 2026
- Evidence status
- Survey-based
- Editorial review
- Reviewed 9 October 2026
The short version
Survey-based evidence
How many young people are outside work, education or training?
981,000 young people are missing out on work and learning
1996–2026 · recorded figures. Shading marks years without figures: this series starts in 2001.
More young people are outside work and learning than at the recent low. The survey is less reliable for small short-term changes, and older figures were measured differently.
Show the workings — 981,000 young people are missing out on work and learning
Young people aged 16–24 not in education, employment or training, as a percentage of ALL people aged 16–24, UK, seasonally adjusted, quarterly, Oct–Dec 2001 to Apr–Jun 2026. The latest count is printed beside the end of the line.
The estimated share was 9.7% in April to June 2021 and 13.0% in April to June 2026. These point estimates indicate a higher level than the post-2019 low, but recent sampling volatility limits short-term conclusions. The latest level has a 95% interval of about ±0.9 percentage points; that is not a significance test for the change. A weighting break in 2019 means earlier levels provide historical context rather than a directly comparable benchmark.
- Geography:
- United Kingdom — All people aged 16–24 (the denominator includes students and workers)
- Measure:
- Per cent of all people aged 16–24
- Period:
- Oct–Dec 2001 to Apr–Jun 2026 (quarterly)
- Status:
- Survey-based
- Calculation:
- As published (Table 1, people, seasonally adjusted). Rate to one decimal place.
- Compare with:
- The Jul–Sep 2011 peak (16.9%) and the Apr–Jun 2021 low (9.7%)
- Not included / breaks:
- ONS reweighted the survey from January–March 2019, causing a step change, so the line is broken there; compare levels either side with care. Mid-2023 and 2024 estimates remain volatile. NEET is not a narrower unemployment rate: it uses all young people as the denominator, and most NEET young people are not unemployed but economically inactive.
Source: ONS, Young people not in education, employment or training (NEET), UK, Table 1 (seasonally adjusted) (released 27 August 2026).
View the data as a table
| Quarter | NEET rate (%) | NEET (thousands) |
|---|---|---|
| Oct–Dec 2001 | 12.9 | 833 |
| Jan–Mar 2002 | 13.3 | 859 |
| Apr–Jun 2002 | 13.4 | 873 |
| Jul–Sep 2002 | 13.3 | 873 |
| Oct–Dec 2002 | 12.7 | 836 |
| Jan–Mar 2003 | 13.5 | 893 |
| Apr–Jun 2003 | 13.4 | 891 |
| Jul–Sep 2003 | 13.1 | 877 |
| Oct–Dec 2003 | 12.6 | 847 |
| Jan–Mar 2004 | 12.4 | 836 |
| Apr–Jun 2004 | 12.9 | 879 |
| Jul–Sep 2004 | 13.4 | 918 |
| Oct–Dec 2004 | 13.4 | 922 |
| Jan–Mar 2005 | 13.4 | 925 |
| Apr–Jun 2005 | 13.7 | 947 |
| Jul–Sep 2005 | 13.5 | 935 |
| Oct–Dec 2005 | 14.4 | 1,003 |
| Jan–Mar 2006 | 14.1 | 984 |
| Apr–Jun 2006 | 14.6 | 1,022 |
| Jul–Sep 2006 | 14.3 | 1,006 |
| Oct–Dec 2006 | 13.8 | 979 |
| Jan–Mar 2007 | 14.1 | 1,000 |
| Apr–Jun 2007 | 14.1 | 1,004 |
| Jul–Sep 2007 | 13.7 | 983 |
| Oct–Dec 2007 | 13.4 | 965 |
| Jan–Mar 2008 | 13.4 | 966 |
| Apr–Jun 2008 | 13.8 | 998 |
| Jul–Sep 2008 | 14.3 | 1,034 |
| Oct–Dec 2008 | 14.2 | 1,025 |
| Jan–Mar 2009 | 15.1 | 1,097 |
| Apr–Jun 2009 | 15.6 | 1,128 |
| Jul–Sep 2009 | 15.4 | 1,122 |
| Oct–Dec 2009 | 14.9 | 1,083 |
| Jan–Mar 2010 | 15.5 | 1,128 |
| Apr–Jun 2010 | 14.7 | 1,074 |
| Jul–Sep 2010 | 15.3 | 1,120 |
| Oct–Dec 2010 | 15.9 | 1,164 |
| Jan–Mar 2011 | 15.3 | 1,125 |
| Apr–Jun 2011 | 15.8 | 1,164 |
| Jul–Sep 2011 | 16.9 | 1,246 |
| Oct–Dec 2011 | 16.5 | 1,212 |
| Jan–Mar 2012 | 16.2 | 1,193 |
| Apr–Jun 2012 | 16.2 | 1,192 |
| Jul–Sep 2012 | 15.0 | 1,104 |
| Oct–Dec 2012 | 14.8 | 1,084 |
| Jan–Mar 2013 | 15.0 | 1,100 |
| Apr–Jun 2013 | 14.9 | 1,089 |
| Jul–Sep 2013 | 14.9 | 1,092 |
| Oct–Dec 2013 | 14.2 | 1,038 |
| Jan–Mar 2014 | 13.4 | 979 |
| Apr–Jun 2014 | 13.2 | 963 |
| Jul–Sep 2014 | 13.3 | 967 |
| Oct–Dec 2014 | 13.3 | 971 |
| Jan–Mar 2015 | 12.8 | 934 |
| Apr–Jun 2015 | 12.7 | 919 |
| Jul–Sep 2015 | 11.8 | 856 |
| Oct–Dec 2015 | 11.9 | 858 |
| Jan–Mar 2016 | 12.0 | 866 |
| Apr–Jun 2016 | 11.7 | 844 |
| Jul–Sep 2016 | 12.0 | 860 |
| Oct–Dec 2016 | 11.5 | 822 |
| Jan–Mar 2017 | 11.2 | 795 |
| Apr–Jun 2017 | 11.2 | 791 |
| Jul–Sep 2017 | 11.3 | 796 |
| Oct–Dec 2017 | 11.3 | 793 |
| Jan–Mar 2018 | 11.4 | 798 |
| Apr–Jun 2018 | 11.1 | 778 |
| Jul–Sep 2018 | 10.9 | 758 |
| Oct–Dec 2018 | 11.3 | 789 |
| Jan–Mar 2019 | 11.2 | 782 |
| Apr–Jun 2019 | 11.5 | 808 |
| Jul–Sep 2019 | 11.5 | 806 |
| Oct–Dec 2019 | 10.8 | 750 |
| Jan–Mar 2020 | 11.4 | 797 |
| Apr–Jun 2020 | 11.6 | 808 |
| Jul–Sep 2020 | 11.2 | 777 |
| Oct–Dec 2020 | 11.8 | 818 |
| Jan–Mar 2021 | 10.7 | 745 |
| Apr–Jun 2021 | 9.7 | 675 |
| Jul–Sep 2021 | 10.2 | 708 |
| Oct–Dec 2021 | 10.3 | 724 |
| Jan–Mar 2022 | 10.6 | 743 |
| Apr–Jun 2022 | 10.5 | 742 |
| Jul–Sep 2022 | 10.4 | 734 |
| Oct–Dec 2022 | 11.9 | 842 |
| Jan–Mar 2023 | 11.6 | 826 |
| Apr–Jun 2023 | 11.7 | 839 |
| Jul–Sep 2023 | 11.9 | 855 |
| Oct–Dec 2023 | 12.1 | 876 |
| Jan–Mar 2024 | 12.9 | 936 |
| Apr–Jun 2024 | 12.6 | 920 |
| Jul–Sep 2024 | 12.9 | 950 |
| Oct–Dec 2024 | 13.3 | 981 |
| Jan–Mar 2025 | 12.3 | 912 |
| Apr–Jun 2025 | 12.8 | 951 |
| Jul–Sep 2025 | 12.6 | 943 |
| Oct–Dec 2025 | 12.8 | 958 |
| Jan–Mar 2026 | 13.5 | 1,011 |
| Apr–Jun 2026 | 13.0 | 981 |
Budget 2026 · 28 October 2026
What the Budget means for jobs & pay
5
Budget measures on this topic
£0
No net effect, 2026–27
£235m
Net cost, 2029–30
Biggest single-year effect of each measure · red costs money, teal saves or raises it
- Spring 2026 Youth Employment and Skills Package2028–29−£375m
- Trading Allowance2028–29−£225m
- Parental Pay2029–30−£70m
- Youth Employment and Skills2028–29−£70m
- Skills2027–28−£20m
−£375m
cost in 2028–29
Spring 2026 Youth Employment and Skills Package
−£225m
cost in 2028–29
Trading Allowance
−£70m
cost in 2029–30
Parental Pay
All 5 measures on this topic
−£70m
cost in 2028–29
Youth Employment and Skills
−£20m
cost in 2027–28
Skills
Treasury costings certified by the OBR, not measured results. Topic links are UK Facts’ classification.
The evidence
Getting a first job, holding on to one through illness, and earning enough to get ahead are different challenges. The unemployment rate alone cannot tell all three stories.
Different age groups and periods; these figures overlap and must not be added. Recent labour-market estimates are uncertain: focus on the longer pattern, not a single quarter.
Outside the labour market: who, why and where
Being economically inactive means neither working nor looking for work. It is the larger of the two groups outside work, about five times the number of unemployed people. But it is not all a problem: about two in five inactive people are students or retired. The part that has grown is long-term sickness, up about a third since late 2019. Fewer people are looking after family or home. Unemployment is a different group, people who are looking for work, and it has risen more as a share of the labour force.
Inactive (not looking or not available), 16 to 64
9.1 million people. The rate is nearly unchanged since 2019.
- Late 201920.6%
- Now20.9%
Unemployed (looking and available), 16 and over
1.7 million people. The rate is a percentage of people in the labour force, so it is not comparable in size with the left chart.
- Late 20193.7%
- Now4.7%
Economically inactive people aged 16 to 64 by main reason, October to December 2019 and June to August 2026. Long-term sickness is up 658 thousand. Students and retirees are not a problem count: they are about two-fifths of the total.
- Long-term sick, 20192.08m
- Long-term sick, 20262.74m
- Students, 20192.30m
- Students, 20262.45m
- Looking after family or home, 20191.92m
- Looking after family or home, 20261.56m
- Retired, 20191.13m
- Retired, 20261.08m
- Other, 20190.95m
- Other, 20261.04m
- Temporarily sick, 20190.16m
- Temporarily sick, 20260.19m
Illness-related inactivity was estimated to cost about £212bn a year in the Keep Britain Working review. Keep Britain Working review (Nov 2025): about £212bn a year, about 7% of GDP, including employers about £85bn. An estimate with a wide range; not a saving available from policy.
Who is affected most
Women are still more likely to be inactive than men, but the gap has narrowed from 17 points in 1996 to about 7. Rates are highest in the North East and lowest in the South West and South East. Pakistani and Bangladeshi women’s caring and study account for much of the highest ethnic-group rate. County figures have wide margins of error, so we show ranges, not a league table. The Annual Population Survey is a sample, and small groups and small areas carry large uncertainty.
By sex
Inactivity rate, 16 to 64. The gap has narrowed from 17 points to about 7. Since 2019 men’s rate rose (16.2% to 17.4%) and women’s fell (24.6% to 24.2%).
- Women, 199632.2%
- Women, now24.3%
- Men, 199615.2%
- Men, now17.5%
By ethnic group
July 2025 to June 2026, UK, aged 16 to 64. Rates are for inactivity of any reason, including students and caring. Intervals include only count error; the true margins are wider for small groups.
- Pakistani or Bangladeshi33%±3
- Mixed27%±3
- Other (includes Chinese and Arab)25%±2
- Black22%±2
- White20%±0
- Indian17%±2
UK nations and England’s regions
Inactivity rate, 16 to 64, July 2025 to June 2026 (Annual Population Survey; rates derived from counts).
- UK20.9%
- Wales23.7%
- Scotland22.4%
- Northern Ireland24.7%
- England: North East24.3%
- England: North West22.4%
- England: Yorkshire and The Humber22.4%
- England: West Midlands22.0%
- England: East Midlands20.6%
- England: London20.6%
- England: East of England18.7%
- England: South East18.2%
- England: South West18.1%
North, Midlands and South
The North is 3.7 points higher than the South. Our grouping, not an ONS definition. North = North East, North West and Yorkshire and The Humber. Midlands = East and West Midlands. South = East of England, London, South East and South West. Pooled from summed counts, never an average of rates.
- North22.7%
- Midlands21.4%
- South19.1%
By age
Inactivity rate by age. Inactivity is highest among 16 to 19s (mostly in study) and 50 to 64s. A 2024 Resolution Foundation analysis found these two groups accounted for 90% of the rise since 2019; that has not been recomputed for 2026.
- 16 to 1960%mostly full-time students
- 20 to 2426%
- 25 to 3412%
- 35 to 4912%
- 50 to 6426%
County by county: lowest and highest
October 2024 to September 2025, English county council areas, five lowest then five highest of those listed. County council areas with wide sampling intervals (about plus or minus 2 points for Hampshire). Shown as ranges, not a league table.
- Gloucestershire15.8%
- Buckinghamshire15.9%
- Hertfordshire16.2%
- Oxfordshire16.2%
- Warwickshire16.5%
- Nottinghamshire22.5%
- Lincolnshire22.1%
- Kent21.8%
- North Yorkshire21.5%
- East Sussex21.4%
How the UK compares with the G7
The UK is the only G7 country where the inactivity rate is higher than in 2019, though only by 0.2 points. Germany, Japan, France and Italy have all seen employment rise. UK unemployment rose by about a point; Canada’s rose more.
Inactivity rate, ages 15 to 64. The UK is the only G7 country where it is higher than in 2019, by 0.2 points. The UK level is mid-table. Rates differ by a few tenths from ONS headline figures because of the age band; US 2024.
- Italy, 201934.3%
- Italy, 202533.3%
- France, 201927.4%
- France, 202524.9%
- United States, 201925.9%
- United States, 202425.1%
- United Kingdom, 201920.8%
- United Kingdom, 202521.0%
- Canada, 201920.9%
- Canada, 202520.2%
- Germany, 201922.9%
- Germany, 202519.7%
- Japan, 201920.2%
- Japan, 202517.7%
OECD, Short-term labour market statistics, ages 15 to 64 (rates derived from levels). National surveys differ in design and quality.
A route into work or learning is missing for too many.
Leaving education does not always lead straight to a job. Some young people are searching; others face barriers that job adverts alone cannot solve. Start with how many are outside both work and learning.
Annual data: Young people outside work and learning
Each year uses April–June, not an annual average or sum of overlapping quarters. The published quarterly record starts in late 2001, so these April–June snapshots begin in 2002. There is no comparable 1996 NEET observation in this source. Reweighting creates a break from January–March 2019; do not interpret a difference across it as wholly real change. Recent LFS estimates remain volatile, especially mid-2023 and 2024. A dash means no comparable observation is supplied; it is not zero. United Kingdom, all people aged 16–24, seasonally adjusted. NEET includes unemployed and economically inactive people.
1996–2026; April–June snapshots: per cent and thousand people. No change is calculated across definition or assessment breaks.
| Year | NEET (%) | NEET (thousands) |
|---|---|---|
| 1996–2001 | No comparable observations supplied | |
| 2002 | 13.4 | 872.9 |
| 2003 | 13.4 | 891.1 |
| 2004 | 12.9 | 879.2 |
| 2005 | 13.7 | 946.9 |
| 2006 | 14.6 | 1,021.5 |
| 2007 | 14.1 | 1,004.2 |
| 2008 | 13.8 | 998.3 |
| 2009 | 15.6 | 1,127.8 |
| 2010 | 14.7 | 1,073.8 |
| 2011 | 15.8 | 1,164.3 |
| 2012 | 16.2 | 1,191.8 |
| 2013 | 14.9 | 1,089.2 |
| 2014 | 13.2 | 963.2 |
| 2015 | 12.7 | 919.1 |
| 2016 | 11.7 | 844.3 |
| 2017 | 11.2 | 791.3 |
| 2018 | 11.1 | 778.2 |
| 2019 | 11.5 | 807.9 |
| 2020 | 11.6 | 807.7 |
| 2021 | 9.7 | 674.6 |
| 2022 | 10.5 | 741.5 |
| 2023 | 11.7 | 838.9 |
| 2024 | 12.6 | 919.9 |
| 2025 | 12.8 | 950.9 |
| 2026 | 13 | 980.7 |
Same headline. Different barriers.
Looking for a job is only part of the story.
Of the 981,000 young people outside work, education and training in Apr–Jun 2026:
393,000
Were looking for work and available to start
For this group, finding a suitable vacancy and a chance to build experience matter.
588,000
Were not looking or not available to start
This includes different circumstances, such as ill health or caring. This table does not tell us how many face each barrier.
Why this differs from the unemployment rate
“NEET” means not in education, employment or training. Its rate counts all 16–24-year-olds. Youth unemployment is 15.6% (June to August 2026), but counts only those working or looking for work, including students seeking a part-time job. The rates have different denominators.
Illness can close the door to work. Support has to help reopen it.
For someone managing a health condition, being told to find a job may miss the immediate problem. Treatment, workplace adjustments and suitable hours can matter alongside employment support. The figures show the scale of the challenge, not a verdict on anyone’s willingness to work.
Survey-based evidence
Is ill health keeping more people out of work?
2.74 million people are out of work through long-term sickness, up from 2.08 million before Covid
1996–2026 · recorded figures. Shading marks years without figures: this series starts in 2000.
Long-term sickness keeps far more people out of work than before the pandemic. The number has eased from its peak, but these figures cannot tell us how much each possible cause matters.
Show the workings — 2.74 million people are out of work through long-term sickness, up from 2.08 million before Covid
People aged 16–64 who are economically inactive — not working and not seeking work or not available to start — because of long-term sickness, UK, seasonally adjusted, rolling three-month estimates, 2000 to June to August 2026.
The number out of work through long-term sickness barely moved for a decade, then rose by about 660,000 after 2019. It peaked in Sep–Nov 2023 and has edged down since, but remains far above its pre-pandemic level. The survey cannot say why: mental health conditions, longer NHS waits and an older workforce are all associated with the rise, and their relative weight is still being researched.
- Geography:
- United Kingdom — People aged 16–64
- Measure:
- Millions of people
- Period:
- 2000 to Jun–Aug 2026
- Status:
- Official statistics, Labour Force Survey; ONS advises caution over short-term changes
- Calculation:
- As published (LF69, thousands) divided by 1,000. Each point is a three-month window, plotted at its final month.
- Compare with:
- October–December 2019, 2.08 million; peak 2.85 million in Sep–Nov 2023
- Not included / breaks:
- Counts only people whose MAIN reason for inactivity is long-term sickness; people working with a health condition, and the unemployed, are not in it. A different measure from the unemployment rate — do not add them together.
Source: ONS, Labour Force Survey: economically inactive because of long-term sickness, 16–64, LF69 (released 15 September 2026).
View the data as a table
| Three months to | Long-term sick (thousands) |
|---|---|
| Nov–Jan 2000 | 2,291 |
| Dec–Feb 2000 | 2,295 |
| Jan–Mar 2000 | 2,306 |
| Feb–Apr 2000 | 2,312 |
| Mar–May 2000 | 2,302 |
| Apr–Jun 2000 | 2,290 |
| May–Jul 2000 | 2,288 |
| Jun–Aug 2000 | 2,303 |
| Jul–Sep 2000 | 2,310 |
| Aug–Oct 2000 | 2,318 |
| Sep–Nov 2000 | 2,355 |
| Oct–Dec 2000 | 2,341 |
| Nov–Jan 2001 | 2,336 |
| Dec–Feb 2001 | 2,337 |
| Jan–Mar 2001 | 2,342 |
| Feb–Apr 2001 | 2,341 |
| Mar–May 2001 | 2,349 |
| Apr–Jun 2001 | 2,341 |
| May–Jul 2001 | 2,363 |
| Jun–Aug 2001 | 2,365 |
| Jul–Sep 2001 | 2,370 |
| Aug–Oct 2001 | 2,391 |
| Sep–Nov 2001 | 2,387 |
| Oct–Dec 2001 | 2,384 |
| Nov–Jan 2002 | 2,385 |
| Dec–Feb 2002 | 2,382 |
| Jan–Mar 2002 | 2,384 |
| Feb–Apr 2002 | 2,361 |
| Mar–May 2002 | 2,369 |
| Apr–Jun 2002 | 2,362 |
| May–Jul 2002 | 2,360 |
| Jun–Aug 2002 | 2,316 |
| Jul–Sep 2002 | 2,307 |
| Aug–Oct 2002 | 2,293 |
| Sep–Nov 2002 | 2,291 |
| Oct–Dec 2002 | 2,283 |
| Nov–Jan 2003 | 2,314 |
| Dec–Feb 2003 | 2,323 |
| Jan–Mar 2003 | 2,307 |
| Feb–Apr 2003 | 2,284 |
| Mar–May 2003 | 2,271 |
| Apr–Jun 2003 | 2,261 |
| May–Jul 2003 | 2,263 |
| Jun–Aug 2003 | 2,257 |
| Jul–Sep 2003 | 2,266 |
| Aug–Oct 2003 | 2,293 |
| Sep–Nov 2003 | 2,299 |
| Oct–Dec 2003 | 2,301 |
| Nov–Jan 2004 | 2,273 |
| Dec–Feb 2004 | 2,273 |
| Jan–Mar 2004 | 2,279 |
| Feb–Apr 2004 | 2,304 |
| Mar–May 2004 | 2,309 |
| Apr–Jun 2004 | 2,315 |
| May–Jul 2004 | 2,320 |
| Jun–Aug 2004 | 2,338 |
| Jul–Sep 2004 | 2,339 |
| Aug–Oct 2004 | 2,324 |
| Sep–Nov 2004 | 2,314 |
| Oct–Dec 2004 | 2,307 |
| Nov–Jan 2005 | 2,292 |
| Dec–Feb 2005 | 2,283 |
| Jan–Mar 2005 | 2,285 |
| Feb–Apr 2005 | 2,327 |
| Mar–May 2005 | 2,311 |
| Apr–Jun 2005 | 2,296 |
| May–Jul 2005 | 2,266 |
| Jun–Aug 2005 | 2,256 |
| Jul–Sep 2005 | 2,248 |
| Aug–Oct 2005 | 2,265 |
| Sep–Nov 2005 | 2,264 |
| Oct–Dec 2005 | 2,255 |
| Nov–Jan 2006 | 2,247 |
| Dec–Feb 2006 | 2,229 |
| Jan–Mar 2006 | 2,223 |
| Feb–Apr 2006 | 2,211 |
| Mar–May 2006 | 2,233 |
| Apr–Jun 2006 | 2,242 |
| May–Jul 2006 | 2,227 |
| Jun–Aug 2006 | 2,198 |
| Jul–Sep 2006 | 2,194 |
| Aug–Oct 2006 | 2,214 |
| Sep–Nov 2006 | 2,229 |
| Oct–Dec 2006 | 2,228 |
| Nov–Jan 2007 | 2,214 |
| Dec–Feb 2007 | 2,245 |
| Jan–Mar 2007 | 2,242 |
| Feb–Apr 2007 | 2,247 |
| Mar–May 2007 | 2,211 |
| Apr–Jun 2007 | 2,209 |
| May–Jul 2007 | 2,216 |
| Jun–Aug 2007 | 2,215 |
| Jul–Sep 2007 | 2,200 |
| Aug–Oct 2007 | 2,201 |
| Sep–Nov 2007 | 2,202 |
| Oct–Dec 2007 | 2,220 |
| Nov–Jan 2008 | 2,228 |
| Dec–Feb 2008 | 2,215 |
| Jan–Mar 2008 | 2,224 |
| Feb–Apr 2008 | 2,221 |
| Mar–May 2008 | 2,196 |
| Apr–Jun 2008 | 2,174 |
| May–Jul 2008 | 2,175 |
| Jun–Aug 2008 | 2,201 |
| Jul–Sep 2008 | 2,227 |
| Aug–Oct 2008 | 2,197 |
| Sep–Nov 2008 | 2,182 |
| Oct–Dec 2008 | 2,149 |
| Nov–Jan 2009 | 2,163 |
| Dec–Feb 2009 | 2,173 |
| Jan–Mar 2009 | 2,160 |
| Feb–Apr 2009 | 2,145 |
| Mar–May 2009 | 2,153 |
| Apr–Jun 2009 | 2,144 |
| May–Jul 2009 | 2,156 |
| Jun–Aug 2009 | 2,179 |
| Jul–Sep 2009 | 2,191 |
| Aug–Oct 2009 | 2,168 |
| Sep–Nov 2009 | 2,184 |
| Oct–Dec 2009 | 2,178 |
| Nov–Jan 2010 | 2,175 |
| Dec–Feb 2010 | 2,181 |
| Jan–Mar 2010 | 2,205 |
| Feb–Apr 2010 | 2,228 |
| Mar–May 2010 | 2,233 |
| Apr–Jun 2010 | 2,246 |
| May–Jul 2010 | 2,234 |
| Jun–Aug 2010 | 2,228 |
| Jul–Sep 2010 | 2,224 |
| Aug–Oct 2010 | 2,228 |
| Sep–Nov 2010 | 2,230 |
| Oct–Dec 2010 | 2,230 |
| Nov–Jan 2011 | 2,205 |
| Dec–Feb 2011 | 2,183 |
| Jan–Mar 2011 | 2,190 |
| Feb–Apr 2011 | 2,191 |
| Mar–May 2011 | 2,192 |
| Apr–Jun 2011 | 2,189 |
| May–Jul 2011 | 2,191 |
| Jun–Aug 2011 | 2,189 |
| Jul–Sep 2011 | 2,189 |
| Aug–Oct 2011 | 2,186 |
| Sep–Nov 2011 | 2,175 |
| Oct–Dec 2011 | 2,139 |
| Nov–Jan 2012 | 2,121 |
| Dec–Feb 2012 | 2,154 |
| Jan–Mar 2012 | 2,156 |
| Feb–Apr 2012 | 2,159 |
| Mar–May 2012 | 2,164 |
| Apr–Jun 2012 | 2,140 |
| May–Jul 2012 | 2,125 |
| Jun–Aug 2012 | 2,072 |
| Jul–Sep 2012 | 2,064 |
| Aug–Oct 2012 | 2,087 |
| Sep–Nov 2012 | 2,062 |
| Oct–Dec 2012 | 2,052 |
| Nov–Jan 2013 | 2,046 |
| Dec–Feb 2013 | 2,053 |
| Jan–Mar 2013 | 2,070 |
| Feb–Apr 2013 | 2,060 |
| Mar–May 2013 | 2,059 |
| Apr–Jun 2013 | 2,064 |
| May–Jul 2013 | 2,013 |
| Jun–Aug 2013 | 2,007 |
| Jul–Sep 2013 | 1,984 |
| Aug–Oct 2013 | 1,974 |
| Sep–Nov 2013 | 2,016 |
| Oct–Dec 2013 | 2,043 |
| Nov–Jan 2014 | 2,041 |
| Dec–Feb 2014 | 2,007 |
| Jan–Mar 2014 | 1,996 |
| Feb–Apr 2014 | 1,998 |
| Mar–May 2014 | 1,990 |
| Apr–Jun 2014 | 1,991 |
| May–Jul 2014 | 2,027 |
| Jun–Aug 2014 | 2,018 |
| Jul–Sep 2014 | 2,022 |
| Aug–Oct 2014 | 2,024 |
| Sep–Nov 2014 | 2,039 |
| Oct–Dec 2014 | 2,036 |
| Nov–Jan 2015 | 2,028 |
| Dec–Feb 2015 | 2,024 |
| Jan–Mar 2015 | 2,026 |
| Feb–Apr 2015 | 2,042 |
| Mar–May 2015 | 2,075 |
| Apr–Jun 2015 | 2,085 |
| May–Jul 2015 | 2,094 |
| Jun–Aug 2015 | 2,102 |
| Jul–Sep 2015 | 2,111 |
| Aug–Oct 2015 | 2,078 |
| Sep–Nov 2015 | 2,088 |
| Oct–Dec 2015 | 2,074 |
| Nov–Jan 2016 | 2,105 |
| Dec–Feb 2016 | 2,081 |
| Jan–Mar 2016 | 2,100 |
| Feb–Apr 2016 | 2,089 |
| Mar–May 2016 | 2,055 |
| Apr–Jun 2016 | 2,042 |
| May–Jul 2016 | 2,035 |
| Jun–Aug 2016 | 2,009 |
| Jul–Sep 2016 | 2,007 |
| Aug–Oct 2016 | 1,990 |
| Sep–Nov 2016 | 1,999 |
| Oct–Dec 2016 | 1,959 |
| Nov–Jan 2017 | 1,991 |
| Dec–Feb 2017 | 1,985 |
| Jan–Mar 2017 | 1,991 |
| Feb–Apr 2017 | 1,979 |
| Mar–May 2017 | 1,994 |
| Apr–Jun 2017 | 1,982 |
| May–Jul 2017 | 2,007 |
| Jun–Aug 2017 | 2,023 |
| Jul–Sep 2017 | 2,055 |
| Aug–Oct 2017 | 2,032 |
| Sep–Nov 2017 | 1,982 |
| Oct–Dec 2017 | 1,997 |
| Nov–Jan 2018 | 1,987 |
| Dec–Feb 2018 | 1,984 |
| Jan–Mar 2018 | 1,977 |
| Feb–Apr 2018 | 1,986 |
| Mar–May 2018 | 2,004 |
| Apr–Jun 2018 | 2,043 |
| May–Jul 2018 | 2,049 |
| Jun–Aug 2018 | 2,032 |
| Jul–Sep 2018 | 2,000 |
| Aug–Oct 2018 | 1,983 |
| Sep–Nov 2018 | 1,992 |
| Oct–Dec 2018 | 2,007 |
| Nov–Jan 2019 | 2,006 |
| Dec–Feb 2019 | 1,979 |
| Jan–Mar 2019 | 2,012 |
| Feb–Apr 2019 | 1,983 |
| Mar–May 2019 | 2,026 |
| Apr–Jun 2019 | 2,030 |
| May–Jul 2019 | 2,062 |
| Jun–Aug 2019 | 2,067 |
| Jul–Sep 2019 | 2,062 |
| Aug–Oct 2019 | 2,089 |
| Sep–Nov 2019 | 2,086 |
| Oct–Dec 2019 | 2,080 |
| Nov–Jan 2020 | 2,117 |
| Dec–Feb 2020 | 2,118 |
| Jan–Mar 2020 | 2,229 |
| Feb–Apr 2020 | 2,243 |
| Mar–May 2020 | 2,234 |
| Apr–Jun 2020 | 2,233 |
| May–Jul 2020 | 2,262 |
| Jun–Aug 2020 | 2,288 |
| Jul–Sep 2020 | 2,327 |
| Aug–Oct 2020 | 2,320 |
| Sep–Nov 2020 | 2,291 |
| Oct–Dec 2020 | 2,328 |
| Nov–Jan 2021 | 2,297 |
| Dec–Feb 2021 | 2,263 |
| Jan–Mar 2021 | 2,307 |
| Feb–Apr 2021 | 2,288 |
| Mar–May 2021 | 2,313 |
| Apr–Jun 2021 | 2,297 |
| May–Jul 2021 | 2,326 |
| Jun–Aug 2021 | 2,376 |
| Jul–Sep 2021 | 2,396 |
| Aug–Oct 2021 | 2,400 |
| Sep–Nov 2021 | 2,446 |
| Oct–Dec 2021 | 2,436 |
| Nov–Jan 2022 | 2,446 |
| Dec–Feb 2022 | 2,460 |
| Jan–Mar 2022 | 2,440 |
| Feb–Apr 2022 | 2,466 |
| Mar–May 2022 | 2,443 |
| Apr–Jun 2022 | 2,506 |
| May–Jul 2022 | 2,581 |
| Jun–Aug 2022 | 2,639 |
| Jul–Sep 2022 | 2,636 |
| Aug–Oct 2022 | 2,586 |
| Sep–Nov 2022 | 2,561 |
| Oct–Dec 2022 | 2,586 |
| Nov–Jan 2023 | 2,670 |
| Dec–Feb 2023 | 2,706 |
| Jan–Mar 2023 | 2,699 |
| Feb–Apr 2023 | 2,689 |
| Mar–May 2023 | 2,665 |
| Apr–Jun 2023 | 2,706 |
| May–Jul 2023 | 2,735 |
| Jun–Aug 2023 | 2,737 |
| Jul–Sep 2023 | 2,742 |
| Aug–Oct 2023 | 2,824 |
| Sep–Nov 2023 | 2,850 |
| Oct–Dec 2023 | 2,849 |
| Nov–Jan 2024 | 2,821 |
| Dec–Feb 2024 | 2,842 |
| Jan–Mar 2024 | 2,824 |
| Feb–Apr 2024 | 2,830 |
| Mar–May 2024 | 2,829 |
| Apr–Jun 2024 | 2,824 |
| May–Jul 2024 | 2,835 |
| Jun–Aug 2024 | 2,796 |
| Jul–Sep 2024 | 2,793 |
| Aug–Oct 2024 | 2,798 |
| Sep–Nov 2024 | 2,805 |
| Oct–Dec 2024 | 2,776 |
| Nov–Jan 2025 | 2,812 |
| Dec–Feb 2025 | 2,784 |
| Jan–Mar 2025 | 2,775 |
| Feb–Apr 2025 | 2,782 |
| Mar–May 2025 | 2,776 |
| Apr–Jun 2025 | 2,780 |
| May–Jul 2025 | 2,792 |
| Jun–Aug 2025 | 2,824 |
| Jul–Sep 2025 | 2,826 |
| Aug–Oct 2025 | 2,818 |
| Sep–Nov 2025 | 2,800 |
| Oct–Dec 2025 | 2,786 |
| Nov–Jan 2026 | 2,785 |
| Dec–Feb 2026 | 2,792 |
| Jan–Mar 2026 | 2,772 |
| Feb–Apr 2026 | 2,772 |
| Mar–May 2026 | 2,747 |
| Apr–Jun 2026 | 2,774 |
| May–Jul 2026 | 2,780 |
| Jun–Aug 2026 | 2,738 |
Keeping a job matters as much as getting one.
This count excludes people already working with a health condition. It also cannot show whether treatment or an adjustment would enable someone to work. Those questions need evidence about support and outcomes.
A job should be a way forward. What does the pay actually buy?
A bigger payslip can still leave a household struggling if prices have risen too. This chart removes inflation, showing how slowly average spending power has improved since the financial crisis.
Survey-based evidence
Has pay kept up with prices?
Average real pay is 4.6% above 2007, 18 years on
Average weekly earnings including bonuses, whole economy, adjusted for prices using CPIHA measure of consumer-price inflation that includes owner-occupiers’ housing costs and Council Tax. Housing costs use a rental-equivalence estimate, not mortgage payments.ONS: definition and context → to 2015 prices, Great Britain, annual averages, 2000–2025.
1996–2026 · recorded figures. Shading marks years without figures: this series starts in 2000.
Show the workings — Average real pay is 4.6% above 2007, 18 years on
- Geography:
- Great Britain — Employees (not the self-employed)
- Measure:
- £ a week at 2015 prices
- Period:
- 2000–2025
- Status:
- Official statistics
- Calculation:
- Annual average of the monthly A3WX series. Real and nominal pay are never compared on this chart.
- Compare with:
- 2007: £505 a week; low £473 in 2014
- Not included / breaks:
- An average (mean) across employees, pulled up by high earners; says nothing about how pay is distributed, about the self-employed, or about Northern Ireland.
Source: ONS, Average Weekly Earnings in real terms (2015 prices), A3WX.
View the data as a table
| Year | £ a week (2015 prices) |
|---|---|
| 2000 | 427 |
| 2001 | 442 |
| 2002 | 449 |
| 2003 | 457 |
| 2004 | 471 |
| 2005 | 482 |
| 2006 | 493 |
| 2007 | 505 |
| 2008 | 505 |
| 2009 | 495 |
| 2010 | 494 |
| 2011 | 487 |
| 2012 | 481 |
| 2013 | 475 |
| 2014 | 473 |
| 2015 | 483 |
| 2016 | 490 |
| 2017 | 489 |
| 2018 | 492 |
| 2019 | 500 |
| 2020 | 504 |
| 2021 | 520 |
| 2022 | 512 |
| 2023 | 514 |
| 2024 | 524 |
| 2025 | 528 |
Finding enough work
Are there jobs — and enough hours?
A job count cannot show whether someone gets the hours they want. Explore vacancies, unemployment and involuntary part-time work.
Jobs and hours →What is left to live on
The same wage can buy very different lives.
Rent, mortgage payments, family size and other income shape what remains after the bills. Compare the household stories.
Living standards →Why it is happening
Our analysis
Many people outside work are not in a position to start immediately. Health, caring responsibilities, suitable jobs and access to individual support all matter.
Who is affected most
The transition out of education is the pressure point.
The risk is higher after age 18. These groups overlap: the chart compares rates within each group, rather than adding up separate groups of people. Each dot is a percentage of its own group.
Survey-based evidence
Who is most likely to miss out on work and learning?
15.2% of 18–24-year-olds are outside work and learning
- Aged 18–2415.2%
- Young men, 16–2413.7%
- All aged 16–2413.0%
- Young women, 16–2412.3%
- Aged 16–175.3%
Young adults are more likely to miss out on work and learning after compulsory education ends. Most are not currently looking for work or able to start. Small annual survey changes may be noise.
Show the workings — 15.2% of 18–24-year-olds are outside work and learning
NEET rate by age group and sex, UK, April to June 2026 (filled dot) and a year earlier (open dot). Each group's own population is the denominator.
The risk sits overwhelmingly with 18–24-year-olds, after compulsory education or training ends in England. Young men are more likely than young women to be NEET, and most NEET young people are economically inactive rather than unemployed: 588,000 are economically inactive and 393,000 unemployed. These are survey estimates: a confidence interval around one level does not show whether a change between two periods is significant, so small year-to-year movements should not be read as real changes. The multi-year pattern is the more reliable signal.
- Geography:
- United Kingdom
- Measure:
- Per cent of each group
- Period:
- Apr–Jun 2026 and a year earlier
- Status:
- Survey-based
- Calculation:
- As published (Table 1: people, men and women, seasonally adjusted).
- Compare with:
- All 16–24-year-olds, 13.0%
- Not included / breaks:
- ONS does not publish NEET estimates below UK level. The 16–17 rate is low partly because young people in England must stay in education or training until 18.
Source: ONS, Young people not in education, employment or training (NEET), UK, Table 1 (seasonally adjusted) (released 27 August 2026).
View the data as a table
| Group | Apr–Jun 2026 | Year earlier |
|---|---|---|
| Aged 18–24 | 15.2 | 15.1 |
| Young men, 16–24 | 13.7 | 13.3 |
| All aged 16–24 | 13.0 | 12.8 |
| Young women, 16–24 | 12.3 | 12.3 |
| Aged 16–17 | 5.3 | 4.5 |
ONS does not publish NEET rates below UK level. For a local view with a different measure: claimant rates across Hampshire’s 13 council areas.
What could change
Proposals to consider. The bodies named below would need to agree to deliver them; responsibility is not a recorded commitment. Follow the links for costs and evidence.
Offer evidence-based employment support alongside healthcare
Link employment support with healthcare and test whether it helps people into work.
Who could deliver it: the Department for Work and Pensions, health commissioners and local employment partners.
Main trade-off and delivery needs
Clinical displacement; unsuitable pressure to work; variable fidelity.
Specify cohort and voluntary offer; secure clinical referrals, trained employment specialists, employer links and linked-data evaluation.
Cost: Only part of the cost has been estimated.
Costs, drawbacks and evidence →Target minimum-wage enforcement where underpayment is highest, and test whether it works
Focus minimum-wage enforcement where workers are most likely to be underpaid, then test the results.
Who could deliver it: Employment departments, employers, enforcement bodies and skills partners.
Main trade-off and delivery needs
Reduced hours/hiring in some settings; displacement; inappropriate generalisation.
Separate wage-floor/enforcement, progression and targeted youth support; specify increment and monitor hours and access.
Cost: The extra cost is not yet known.
Costs, drawbacks and evidence →Employer-linked shortage training beyond construction
Test training linked to employer placements where there are proven shortages outside construction.
Who could deliver it: skills bodies, colleges and employers.
Main trade-off and delivery needs
The main risks still need to be assessed.
Specify sector, cohort, placement and recognised completion; cost tuition, trainee support, employer time, trainers and evaluation. Track earnings and sustained employment. Proposed owners: skills bodies, colleges and employers.
Cost: The extra cost is not yet known.
Costs, drawbacks and evidence →Timely workplace adjustments for disabled workers
Test faster workplace adjustments for disabled workers, making clear what employers must provide and what public support covers.
Who could deliver it: the Department for Work and Pensions, employers and support providers.
Main trade-off and delivery needs
The main risks still need to be assessed.
Audit delays and current legal/service baseline; cost assessors, adjustments, employer contributions and administration. Measure retention, access and worker experience. Proposed owners: DWP, employers and support providers.
Cost: The extra cost is not yet known.
Costs, drawbacks and evidence →
See all options and what is still unknown →
Some problems have no assessed solution yet: see coverage and gaps.
Help and rights
In the options discussed here, IPS — employment supportIndividual Placement and Support: an employment-support model integrated with mental-health care. The same abbreviation can mean something else in other contexts.NHS England: definition and context → means Individual Placement and Support.
These links can help with an individual situation. They do not resolve the wider pressures described above.
- Check workplace rights and advice
Acas provides employment guidance for workers and employers in England, Scotland and Wales.
Domain SWOT
Recorded
Budget 2026 bears on one of these findings
Show the findings
Strengths · 2 findings
Health-linked employment support has been tested in large UK randomised trials: for out-of-work participants in the West Midlands it raised the share working 13 weeks or more in a year by 4 percentage points.
West Midlands and Sheffield City Region · Randomised 2018–2019; outcomes at 12 months
Paid and supported routes are funded: an £820 million Youth Guarantee package includes six-month paid jobs for young people long on Universal Credit, and Connect to Work has committed funding to 2028–29.
Great Britain (Jobs Guarantee); England and Wales (Connect to Work) · December 2025 to 2028–29
Weaknesses · 6 findings
About 2.7 million people of working age are economically inactive because of long-term sickness, 658,000 more than at the end of 2019, while the overall inactivity rate has barely moved. Labour Force Survey estimates carry sampling uncertainty and are revised.
United Kingdom · June to August 2026
Work-coach capacity affects the support people receive. The NAO found that 57% of jobcentres had reduced support when caseloads were too high. It called for better measures of sustained work and job quality; moving into earnings for one month does not establish a lasting job.
Great Britain · NAO report, 31 March 2025; support reductions September 2023–November 2024
981,000 people aged 16–24 (13.0%) were not in education, employment or training; 588,000 of them were economically inactive rather than looking for work.
United Kingdom · Apr–Jun 2026
2.74 million people aged 16–64 were economically inactive because of long-term sickness, against 2.08 million at the end of 2019.
United Kingdom · Oct–Dec 2019 and Jun–Aug 2026
Access to Work decisions averaged 109 working days in November 2025 against a 25-day target (28 days in 2021–22), with 62,100 applications awaiting a decision at 31 March 2025; the employment rate of disabled people was 29.7 points below that of non-disabled people in mid-2025.
Great Britain (Access to Work); United Kingdom (employment gap) · March 2022 to November 2025 (processing); Q2 2025 (employment gap)
About 445,000 jobs were paid below the legal minimum in 2025 (382,000 in 2024), while HMRC identified arrears for 25,200 workers in 2024/25. The underpayment figure is a survey estimate, not proven non-compliance.
United Kingdom · 2024 to 2025 (underpayment); 2024/25 (enforcement)
Opportunities · 1 finding
Match the route to the barrier: paid jobs and apprenticeships for young people ready to work, and health-linked support for people out of work through ill health.
Depends on: Support stays voluntary, placements are real jobs with training, and success is judged on sustained work 6–12 months later rather than starts.
our synthesis
Budget 2026 responds to this
Youth Guarantee and apprenticeship support expanded, with local apprenticeship services extended to all mayors.
Youth Employment and SkillsSpring 2026 Youth Employment and Skills Package
Threats · 1 finding
Gains are modest and fragile: Kickstart left an extra 11 in every 100 participants in unsubsidised work two years on, and weak employer demand, poor placements or diluted delivery could cut that further.
risk
Domain action plan
Proposed
Possible steps for government and the bodies responsible. These describe the order of work, not promised dates: starting an action and seeing results take different amounts of time.
Short term · prepare
Identify people missing suitable work or support.
Medium term · deliver
Connect voluntary employment help, healthcare, training and employers.
Long term · judge results
Track sustained work, earnings and health rather than programme enrolment alone.
Delivery steps and owners (6)
- Prerequisite: Segment young people by barrier and recruit employers with real vacancies · DWP and local delivery partners, with DfE · proposed
- Decision: Fund NHS referral routes and fidelity reviews alongside Connect to Work · DWP delivery areas and NHS commissioners · proposed
- Delivery: Jobs Guarantee national rollout; IPS referrals from clinical teams · DWP delivery partners; Connect to Work providers with NHS teams · proposed
- Result: Sustained work at 6–12 months against comparison groups; NEET and sickness inactivity falling · DWP (payroll data) and ONS · proposed
- Decision: Set an Access to Work decision standard for in-work cases and publish processing times as statistics · DWP · proposed
- Delivery: Target minimum-wage inspections by sector and publish arrears and repeat offending · Fair Work Agency · proposed
Sources, method and changes
Shareable visual summary
Visual summary
2.7 million working-age people are out of work through long-term sickness, 658,000 more than at the end of 2019.
13.0% of 16–24-year-olds in the UK, April–June 2026: 393k unemployed (looking for work) and 588k economically inactive (not seeking work or not available to start, often because of caring, study plans or ill health). Survey estimates.
Share of 16–24-year-olds who are NEET
13.0%
Within the NEET total
- 393k (40.1%) Unemployed (looking and available)
- 588k (59.9%) Economically inactive (not seeking work or not available to start)
Inactive is not the same as unwilling: it includes caring, ill health and people about to start a course.
Text and data version
2.7 million working-age people are out of work through long-term sickness, 658,000 more than at the end of 2019. 13.0% of 16–24-year-olds in the UK, April–June 2026: 393k unemployed (looking for work) and 588k economically inactive (not seeking work or not available to start, often because of caring, study plans or ill health). Survey estimates.
| Measure | Value | Period | Geography | Type | Source |
|---|---|---|---|---|---|
| Young people not in education, employment or training | 981k | Apr–Jun 2026 | United Kingdom | survey estimate | Office for National Statistics, Young people not in education, employment or training |
| NEET rate, 16–24 | 13.0% | Apr–Jun 2026 | United Kingdom | survey estimate | Office for National Statistics, Young people not in education, employment or training |
| NEET and unemployed (looking and available for work) | 393k | Apr–Jun 2026 | United Kingdom | survey estimate | Office for National Statistics, Young people not in education, employment or training |
| NEET and economically inactive (not looking, or not available, for work) | 588k | Apr–Jun 2026 | United Kingdom | survey estimate | Office for National Statistics, Young people not in education, employment or training |
Social card
A landscape card for sharing this finding. Post it with the page link — an uploaded image does not link back by itself.
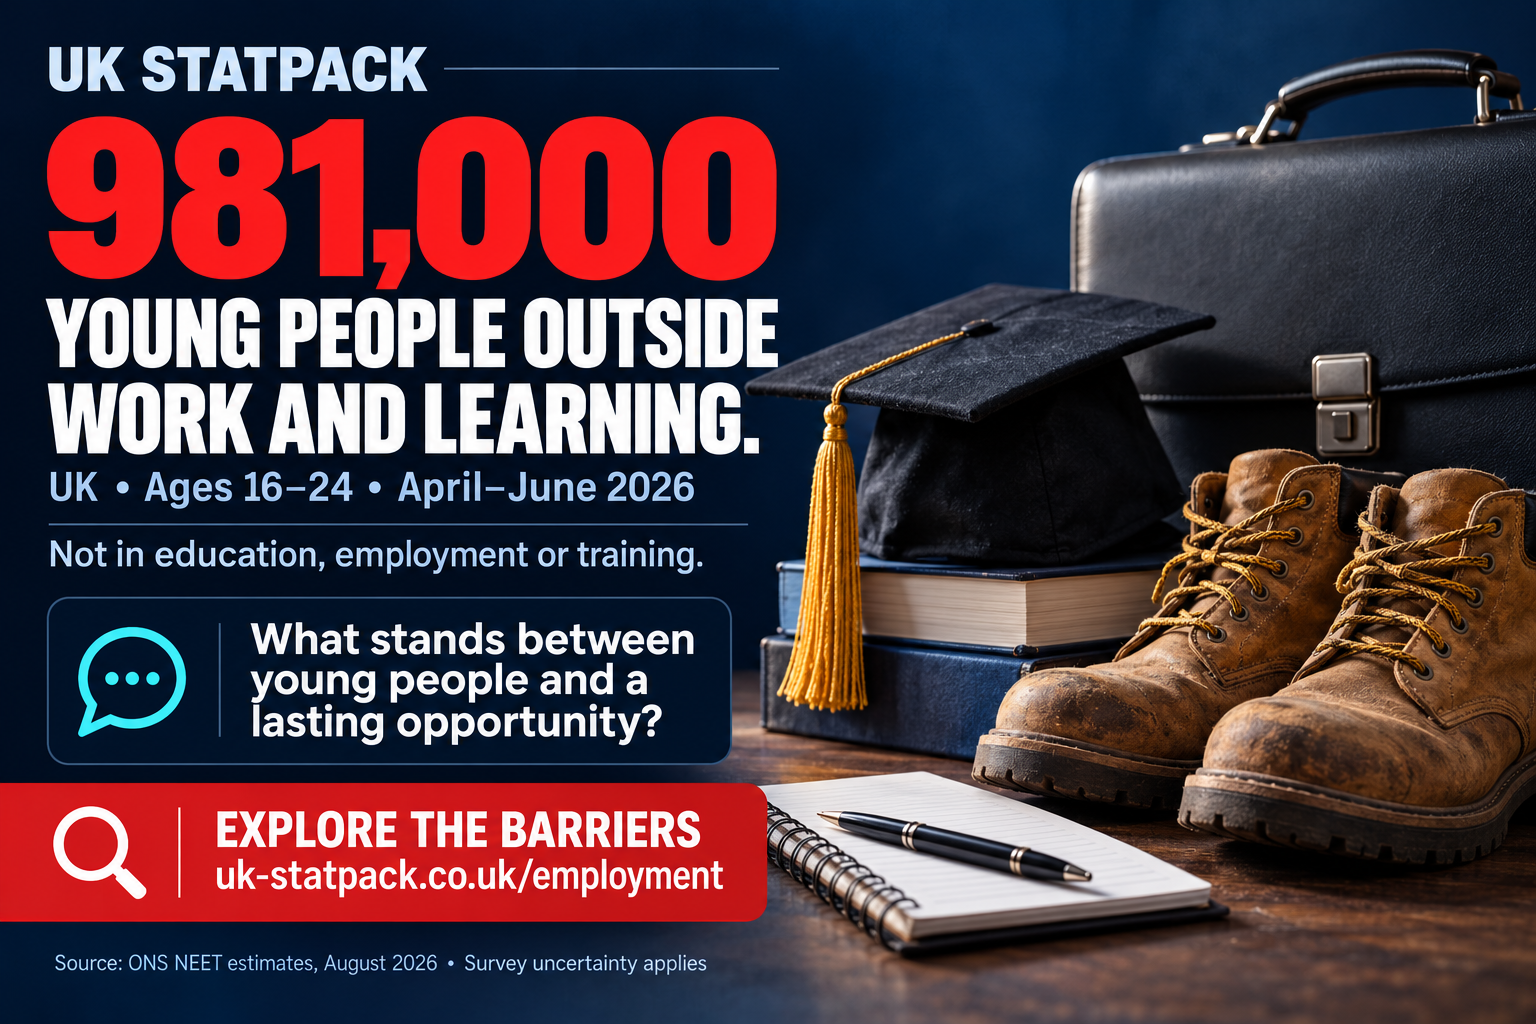
Available images and their source records are listed on Shareable visuals.
Sources and methods (6)
- ONS, Young people not in education, employment or training (NEET), UK, Table 1 (seasonally adjusted) (released 27 August 2026) — NEET counts and rates, by status, age and sex
- ONS, NEET sampling variability, Table NEET 2 (95% confidence intervals) (released 27 August 2026) — 95% intervals for the latest NEET estimates
- ONS, Labour Force Survey: unemployment rate 16+ (MGSX) and 16–24 (MGWY), MGSX, MGWY; MGWY is also published in Table A06 SA (released 15 September 2026) — unemployment rates, 16+ and 16–24
- ONS, A06 SA: Educational status and labour market status for people aged from 16 to 24, Table A06 SA, series MGWY (released 15 September 2026) — cross-check of the 16–24 unemployment rate by three-month window
- ONS, Labour Force Survey: economically inactive because of long-term sickness, 16–64, LF69 (released 15 September 2026) — economic inactivity because of long-term sickness, 16–64
- ONS, Average Weekly Earnings in real terms (2015 prices), A3WX — real average weekly earnings
Method notes
- Labour Force Survey figures are survey estimates with sampling error; ONS designated them official statistics again on 11 August 2026 after a period as “official statistics in development”, and still advises focusing on long-term movements.
- LFS rates are rolling three-month averages, labelled here by their full window (for example “May–Jul 2026”).
- NEET is a share of all people aged 16–24; the unemployment rate is a share of the economically active. They answer different questions and must not be compared as if one were a subset of the other.
- Real pay covers Great Britain (Average Weekly Earnings does not cover Northern Ireland) and is deflated by CPIH (consumer prices including owner occupiers’ housing costs) to 2015 prices.