Headline evidence · Technology · United States, United Kingdom and China · 2025
The US attracted 48 times more private investment in AI than Britain in 2025.
The US attracted 48 times more private investment in AI than Britain in 2025, and 22 times more over 2013 to 2025. Amazon and Microsoft each supply 30 to 40% of Britain's cloud services.
Proposed outcome: Use artificial intelligence where it helps, while reducing dependence on suppliers and planning for failures. What could change →
- Geography
- United States, United Kingdom and China
- Evidence period
- 2025
- Evidence status
- Site calculation from published data
- Editorial review
- Reviewed 21 October 2026
The short version
Three key measures
How much more private AI investment does the US attract than the UK?
48×the UK’s private AI investment
The US attracted 48 times more private investment in AI companies than Britain in 2025. Britain is still third in the world.
How big is Britain’s AI sector? →United States, United Kingdom and China · 2025 · Site calculation from published data
Definition, limits and source: How much more private AI investment does the US attract than the UK?
$285.9bn in the US against $5.9bn in the UK and $12.4bn in China, in 2025. The UK is third in the world, and second for newly funded AI companies (172). It produced 1 of the 95 notable new models counted for the US, China and UK. Commercial database; state funding is excluded.
Site calculation from published data · Stanford HAI, AI Index Report 2026, Figures 4.2.8, 4.2.9 and 1.1.13
How much of its income does the UK spend on research and development?
2.71%of the economy
Britain spends 2.71% of its income on research and development. That is fourth among the G7 countries.
R&D and who owns it →United Kingdom · 2024
Definition, limits and source: How much of its income does the UK spend on research and development?
£79.4bn in 2024. Fourth in the G7 on the latest year each country reports: United States 3.45% (2023), Japan 3.44% (2023), Germany 3.15% (2023), United Kingdom 2.68% (2023), France 2.18% (2023), Canada 1.79% (2024), Italy 1.38% (2023). The World Bank series gives the UK 2.68% for 2023.
Published statistics · ONS, UK gross domestic expenditure on research and development: 2024
Survey-based evidence
ONS Business Enterprise R&D SurveySurvey-based spending estimate; changes in the survey method affect historical comparisons.How much UK business R&D is done by foreign-owned firms?
51%of business R&D
About half of the research done by UK businesses is done by foreign-owned firms.
Who owns UK research →United Kingdom · 2024
Definition, limits and source: How much UK business R&D is done by foreign-owned firms?
21% by US-owned firms and 49% by UK-owned firms in 2024. Survey redesigned in 2022, with 2022 and 2023 revised, so this is a position, not a trend.
Site calculation from published data · ONS, Business enterprise research and development (BERD) 2024, worksheet 15 (by country of ownership of the businesses performing R&D)
Who feels this most?
Smaller organisations are least likely to use AI — 28.7% of the smallest firms against 50.9% of the largest. Adoption may support productivity, but reported use does not establish a productivity gain. For organisations that do adopt, the dependency questions above apply whatever their size; how exposed each sector is has not been measured.
Budget 2026 · 28 October 2026
What the Budget means for technology
4
Budget measures on this topic
£190m
Net cost, 2026–27
£535m
Net cost, 2029–30
Biggest single-year effect of each measure · red costs money, teal saves or raises it
- Investment for Growth2031–32−£535m
- Artificial Intelligence2028–29−£185m
- R&D Tax Reliefs2031–32−£70m
- Backing Innovation2031–32+£25m
−£535m
cost in 2031–32
Investment for Growth
−£185m
cost in 2028–29
Artificial Intelligence
−£70m
cost in 2031–32
R&D Tax Reliefs
All 4 measures on this topic
+£25m
saving or gain in 2031–32
Backing Innovation
The Budget in 2 minutes →Is it being delivered? →
Treasury costings certified by the OBR, not measured results. Topic links are UK Facts’ classification.
The evidence
How big is Britain’s AI sector?
In 2025 alone, the US attracted 48 times more private investment in AI than Britain ($286bn against $5.9bn). Over the whole period from 2013 to 2025 the gap is 22 times. The two figures measure different spans: one year can be lumpy, the cumulative total is steadier. Britain has a real AI ecosystem. It is third in the world for private AI investment since 2013 ($34.1bn, against $757bn for the US) and second for new AI companies funded in 2025. But it is an order of magnitude smaller than the American one, and almost none of the new frontier models come from here. Dependence follows from scale: what Britain does not build, it buys, mostly from American firms.
Private AI investment, 2025
The US attracted 48.5 times as much as the UK.
- United States$285.9bn
- China$12.4bn
- United Kingdom$5.9bn
Newly funded AI companies, 2025
On this count the UK is second in the world, ahead of China.
- United States1,953
- United Kingdom172
- China161
Notable new AI models, 2025
Counted by the country of an author’s employer; one model can count for more than one country.
- United States59
- China35
- South Korea8
- United Kingdom1
Source: Stanford AI Index 2026 (private investment from Quid; notable models from Epoch AI, snapshot 22 April 2026). Private investment excludes state funding, which the report says likely understates China. One notable-model count can be shared between countries.
Research spending, and who owns it
Britain spends 2.71% of GDP on research and development (£79.4bn in 2024). That is fourth in the G7, behind the US, Japan and Germany, and just above China. About 51% of the research done by UK businesses is done by foreign-owned firms.
R&D spending as a share of GDP, latest year available for each country (World Bank, republishing the OECD). The ONS gives the UK as 2.71% for 2024.
- United States3.45%2023
- Japan3.44%2023
- Germany3.15%2023
- United Kingdom2.68%2023
- China (not G7)2.58%2023
- France2.18%2023
- Canada1.79%2024
- Italy1.38%2023
The UK series has breaks in 2014 and 2018, when business R&D coverage was revised, so we compare the latest year only and do not draw a 30-year line. Countries are shown for different latest years. R&D spending is an input: it does not show whether research is turned into products.
49%21%13%17%
- UK-owned: 49.3% (£27.4bn)
- US-owned: 21.3% (£11.8bn)
- Owned elsewhere in the EU: 12.6% (£7.0bn)
- Rest of the world: 16.8% (£9.4bn)
Compute and the price of power
Building more AI capacity in Britain needs electricity at a competitive price and a grid connection. Large UK industrial users pay more than twice the middle price paid across 14 EU countries and the UK. Connection dates for big new users run to several years. Both are reported constraints on building data centres here; they are separate causes, and the evidence shows the constraint, not how many projects it stopped. Energy costs and the energy mix.
Large industrial users
20,000 to 69,999 MWh a year
- United Kingdom23.4p
- Ireland17.2p
- Germany13.9p
- Median of 14 EU countries plus UK10.2p
- France7.4p
- Finland4.4p
UK is 130% above the median.
Very large industrial users
70,000 to 150,000 MWh a year
- United Kingdom21.8p
- Ireland15.0p
- Germany12.5p
- Median of 14 EU countries plus UK10.5p
- France6.2p
- Finland3.7p
UK is 108% above the median.
Pence per kWh including taxes and charges for environmental and social policies, excluding VAT, Jul – Dec, 2025 (DESNZ, from Eurostat; sterling at the exchange rate when published). These are bands for big industrial users, not a data-centre tariff, and there is no like-for-like US figure. Price is one constraint; grid connection dates of several years are another, and the evidence does not show that any particular data centre was not built because of price.
What can UK users access today?
Announced, installed and accessible are different stages. The public AI Research Resource now has 2 systems open to eligible UK researchers and businesses by application, with a capacity target for 2030. The planned Edinburgh national supercomputer is a separate programme. Commercial cloud and model services are another route; these sources do not measure what UK users pay.
What exists, and who can use it?
Two public systems are open by application; the 2030 target is 20 times the 2025 baseline
Each entry keeps its own published unit. Accelerator counts are hardware counts, not a common performance scale, so no row is added to another. Stage labels: accessible now, announced, or target.
| Facility or programme | Stage | Operational | Published capacity (own unit) | Who can apply | Access terms | Evidence date |
|---|---|---|---|---|---|---|
| Isambard-AI, University of Bristol (AIRR)BIST/UKRI, AI Research Resource (AIRR): advanced supercomputers for the UK | Accessible now | Fully running from July 2025 | 5,448 Nvidia GH200 superchips (hardware count, not a performance measure) | UK micro, small and medium organisations (Rapid Access, up to 20,000 GPU hours); academia, industry and other UK organisations (Gateway, up to 10,000 GPU hours) | Allocated by application through the AIRR portal; both routes open with no closing date. Charging terms not stated on the pages checked. | 28 September 2026 |
| Zenith, University of Cambridge (AIRR)BIST/UKRI, AI Research Resource (AIRR): advanced supercomputers for the UK | Accessible now | Listed as an AIRR access route; a £36m upgrade was announced in January 2026 | AMD-based system; published capacity not stated in a comparable unit | As for Isambard-AI (same AIRR routes) | As for Isambard-AI. The earlier Dawn system is now described in the past tense. | 28 September 2026 |
| National supercomputer, Edinburgh (separate from AIRR)DSIT, UK Compute Roadmap | Announced | Planned online in 2027 at EPCC, replacing ARCHER2; not delivered | Not yet specified | Not yet published | Up to £750m announced | UK Compute Roadmap, Action 1 |
| Heterogeneous AIRR supercomputer (Hardware Plan)DSIT, UK AI Hardware Plan | Announced | Announced June 2026; delivery not established by the plan | Mixed advanced compute technologies; no comparable delivered capacity given | Access terms not established by the plan | £750m programme, including £400m specialised-chip procurement opportunity; not two additive budgets | UK AI Hardware Plan, procurement section; does not identify this as Edinburgh |
| AIRR programme as a wholeDSIT, UK Compute Roadmap | Target | 21 AI ExaFLOPS in 2025; 420 targeted by 2030 | AI ExaFLOPS (the precision basis is not stated, so not comparable with vendor chip figures) | Eligible UK researchers and organisations | Part of a Compute Roadmap commitment of up to £2bn to 2030, of which over £1bn is AIRR | No official update on delivered capacity against the target found |
| Commercial cloud (Microsoft, Amazon Web Services, Google and others)CMA, Cloud services market investigation: final decision | Accessible now | Operating | Not published for the UK | Any customer able to pay | Commercial contracts. The CMA found egress fees and software licensing make switching harder; fewer than 1% of customers switch each year. | CMA final decision, 31 July 2025 |
The AIRR target of 420 AI ExaFLOPS by 2030 is a published ambition; no official update on delivered capacity against it has been found. Even at full size, the programme describes itself as a small share of all UK compute, most of which is private and much of which is owned by overseas companies. Domestic compute, funding and electricity in detail.
Adoption and public concerns answer different questions
Annual data: Business AI use: September snapshots
Comparable observations begin in September 2023. These are September survey snapshots, not annual averages. The 1996–2022 gap is intentional. Self-reported use does not measure productivity or service quality. A dash means no comparable observation is supplied; it is not zero. United Kingdom; count-weighted businesses, not workers.
1996–2026; % of trading businesses. No change is calculated across definition or assessment breaks.
| Year | Ten or more employees | All sizes |
|---|---|---|
| 1996–2022 | No comparable observations supplied | |
| 2023 | 11.9 | 9.4 |
| 2024 | 17.8 | 14.7 |
| 2025 | 27.2 | 23.5 |
| 2026 | 38.1 | 29.7 |
Business survey: data and methods
ONS BICS wave 165 ran from 21 September to 4 October 2026 and was published on 8 October. Of 38,592 sampled businesses, 9,933 responded (25.7%); these are whole-wave figures, not the AI question base. This voluntary survey covers private-sector businesses in its industry coverage, not every UK organisation or the public sector. Estimates are count weighted. Non-response and sampling uncertainty remain; the published chart supplies point estimates, so no confidence interval has been invented here. A size gap or change alone is not a significance test.
ONS bulletin, coverage and confidence-interval dataset. Dates below are wave midpoints.
| Wave midpoint | 10+ employees | All sizes |
|---|---|---|
| 24 Sept 2023 | 11.9 | 9.4 |
| 17 Dec 2023 | 11.8 | 9.9 |
| 24 Mar 2024 | 13.8 | 13.8 |
| 23 June 2024 | 14.8 | 12.7 |
| 22 Sept 2024 | 17.8 | 14.7 |
| 22 Dec 2024 | 18.2 | 16.1 |
| 23 Mar 2025 | 20.6 | 17.8 |
| 22 June 2025 | 25.1 | 20.5 |
| 21 Sept 2025 | 27.2 | 23.5 |
| 21 Dec 2025 | 28.7 | 24.7 |
| 22 Mar 2026 | 32.1 | 25.9 |
| 21 June 2026 | 34.9 | 28.9 |
| 27 Sept 2026 | 38.1 | 29.7 |
74% selected inaccurate information as an AI concern
UK adults aged 16+, November 2025–March 2026. Selected responses to a multiple-choice question; concerns can overlap and are not measured rates of harm.
% of adults
- Information might be inaccurate74.1%
- Concerns about privacy and security69.1%
- Loss of jobs due to AI63.1%
Public attitudes: question, data and methods
DSIT Public Engagement Survey 2025/2026, published 16 July 2026, Table E21. Question AIRISK: “Which of the following, if any, concerns you about the use of AI?” Choose all that apply. The question has 30,669 unweighted responses; the full cleaned survey has 30,698. Verian used stratified random address sampling from the Postcode Address File across 46 ITL2 areas, inviting up to four adults per address to respond online or on paper. Of 83,694 issued addresses, the estimated household response rate was 25% and individual response rate 21%. Weights adjust selection, response and population margins; they cannot remove unobserved non-response bias. The weighting design effect is estimated at 1.67. No question-specific confidence intervals are supplied in this table; subgroup differences are not tested here. This first survey supplies no comparable long-term trend.
| Information might be inaccurate | 74.1% |
|---|---|
| Concerns about privacy and security | 69.1% |
| Loss of jobs due to AI | 63.1% |
Domestic compute and its limits
Building more compute in Britain needs chips made abroad, electricity at a competitive price, and a grid connection that can take years. Location is not control: a data centre in the UK may be owned and operated by a company elsewhere. The compute and access deep dive sets out each facility, the funding commitments (which overlap and must not be added together), data-centre electricity use and industrial power prices.
Stress-test assumptions and methods
What would happen if a major overseas AI service were withdrawn or became much more expensive? No official estimate exists, and this site does not assign a probability. The stress-test deep dive offers two hypothetical calculators that run on your own assumptions, the four ways of “competing” in AI, and the questions the evidence cannot yet answer.
Why it is happening
Where access could fail — and what would help
Few cloud customers switch providers. That makes working backups and a practical way to move services important. The market shares do not tell us how dependent the whole economy is.
Market figures and regulation
Microsoft and Amazon Web Services each supplied 30–40% of UK cloud infrastructure and platform services in 2024, on CMA estimates, and fewer than 1% of customers switch provider in a year. In March 2026 the CMA chose not to open cloud cases after both firms took steps on egress fees and interoperability; it is now investigating Microsoft’s business software, with a decision due by 13 February 2027. Since July 2026 the biggest cloud providers are also overseen as critical third parties to the financial system. None of this measures how dependent the wider economy is — there is no defensible single dependency percentage, and this page does not invent one.
Where could access fail?
Every AI service rests on a few layers that UK users do not control
Open a step to see what is observed, the alternatives, what makes switching hard, and what is unknown.
Mechanism diagram — who relies on whom; size does not encode risk
1Organisations using AIBusinesses, public services and researchers that build AI into their work.Show the evidence
- Observed
- 38.1% of firms with ten or more staff report using AI (September 2026); use rises with firm size.
- Alternatives
- Doing without, or using simpler non-AI tools.
- What makes switching hard
- Staff skills, workflows and data built around one provider’s tools.
- Evidence gap
- No measure of how dependent any sector is on AI services continuing.
2Application and model providersCompanies whose models and AI products organisations call on.Show the evidence
- Observed
- About 5,862 active AI companies in the UK (2024, government-commissioned count). Which models UK organisations actually rely on is not measured.
- Alternatives
- Other commercial models; open-weight models run on the organisation’s own or rented compute.
- What makes switching hard
- Prompts, fine-tuning and evaluation work may need redoing; terms of service can change.
- Evidence gap
- No official measure of the share of UK AI use served by UK-developed or UK-controlled models.
3Cloud and computeThe data centres and processors on which models are trained and run.Show the evidence
- Observed
- Microsoft and AWS each hold 30–40% of UK cloud infrastructure and platform services (2024, CMA estimates). Public AIRR compute: 21 AI ExaFLOPS (2025).
- Alternatives
- Other cloud providers; AIRR for eligible research and smaller firms; on-premises hardware.
- What makes switching hard
- The CMA found fewer than 1% of customers switch a year; egress fees and licensing are barriers.
- Evidence gap
- Total UK AI compute capacity, and how much is under UK operational control, are not published.
- Related evidence
4ChipsSpecialist processors, designed and made by a small number of firms abroad.Show the evidence
- Observed
- UK public facilities run on Nvidia (Isambard-AI) and AMD (Zenith) hardware.
- Alternatives
- Few at the leading edge; the UK AI Hardware Plan funds domestic research.
- What makes switching hard
- Software is often optimised for one chip family.
- Evidence gap
- No measure of UK exposure to export controls or supply interruptions.
5Electricity and gridPower for data centres and a grid connection to deliver it.Show the evidence
- Observed
- GB data centres used 4.5 TWh of electricity in 2024 (DESNZ estimate). NESO’s reformed connections pipeline retained 283 GW of projects (8 December 2025).
- Alternatives
- Siting compute abroad, where power is cheaper or faster to connect.
- What makes switching hard
- New connections take years.
- Evidence gap
- No source quantifies how much UK compute growth is held back by grid connections versus other constraints.
- Related evidence
6ConnectivityNetworks linking users to remote compute, much of it overseas.Show the evidence
- Observed
- Most AI services are delivered over the internet from data centres that may be in other countries.
- Alternatives
- Local or UK-hosted deployments for sensitive work.
- What makes switching hard
- Latency and data-protection rules affect where data may be processed.
- Evidence gap
- No public measure of how much UK AI use relies on overseas-hosted processing.
Sources: CMA, Cloud services market investigation: final decision; HM Treasury, UK financial system strengthened with new safeguards for major technology providers.
Who is affected most
What the public thinks
Survey-based evidence
British Social Attitudes 2024Fieldwork: 2024Adults 18+ in Great Britain, technology module (1,529 asked). Estimates have sampling uncertainty.
Most people see technology as a help, and most worry about what AI will do to jobs. 62% were worried that machines and AI would take over many human jobs within ten years. 76% agreed that technology makes life easier.
Share of 1,529 adults in Great Britain asked, British Social Attitudes 2024. Combined “very” and “somewhat” or “strongly agree” and “agree”.
- Worried machines and AI will take many human jobs in the next 10 years62%
- Technology makes our lives easier (agree)76%
- Technology gives the next generation more opportunities (agree)69%
- Technology does more harm than good (agree)21%
No poll found asks whether Britain should build its own AI or what people would give up for it. The page says so rather than filling the gap with a different question. British Social Attitudes 2024 (UK Data Service, study 9478): adults in Great Britain; question wording is in the workings.
Who feels this most?
Survey-based evidence
ONS Business Insights and Conditions SurveyBusinesses report their experience; check the business-size base and weighting.
Are businesses adopting new technology?
About half of large firms use AI; just over a quarter of the smallest do
September 2026
- 0–9 employees28.7%
- 10–49 employees36.1%
- 50–99 employees45.8%
- 100–249 employees50.4%
- 250 or more employees50.9%
More businesses report using artificial intelligence, with larger firms ahead. Reported use does not tell us whether it saves time, improves services or raises profits.
United Kingdom · September 2026 · Official statistics in development; self-reported survey
Show the workings — About half of large firms use AI; just over a quarter of the smallest do
Percentage of UK trading businesses using at least one AI technology, by number of employees, September 2026.
Reported AI use among businesses with ten or more employees rose from 11.9% in September 2023 to 38.1% in September 2026. Larger firms are well ahead. Diffusion — existing firms taking up proven technology — is where most productivity gains from innovation are usually found, and it is the stage the UK measures least well.
- Geography:
- United Kingdom — Trading businesses responding to the Business Insights and Conditions Survey
- Measure:
- % of businesses
- Period:
- September 2026
- Status:
- Official statistics in development; self-reported survey
- Calculation:
- Direct published values from ONS Figure 1, wave 165; no complementary-response calculation. Count weighted, not employment weighted.
- Compare with:
- 11.9% of businesses with 10+ employees in September 2023
- Not included / breaks:
- Self-reported use, which may range from a chatbot trial to production systems. Use is not the same as productive use, and the survey cannot show whether AI raised output.
Source: ONS, Business insights and impact on the UK economy: 8 October 2026, Figure 1 downloadable data; BICS wave 165 (21 September–4 October 2026) (released 8 October 2026).
View the data as a table
| Business size | % using AI |
|---|---|
| 0–9 employees | 28.7 |
| 10–49 employees | 36.1 |
| 50–99 employees | 45.8 |
| 100–249 employees | 50.4 |
| 250 or more employees | 50.9 |
What could change
Should Britain build its own AI? What would it take
No poll asks whether Britain should build its own AI, so public opinion cannot answer “should”. The evidence can say what the choices would involve. Raising research spending to the level of the US and Japan would take about £23bn a year more, most of it from business. The options below are proposals, not appraised policies.
£22.9bn
more R&D a year than in 2024
29%
on top of today’s £79.4bn
1.4×
today’s government-funded R&D (£16.0bn)
Working: (3.50% − 2.71%) × GDP of £2905bn (2024). Business funds £54.5bn of today’s R&D, so most of any rise would have to be private investment, not public grants. Illustrative: constant 2024 GDP and prices, not a forecast, not a costed policy and not appraised to Green Book standard. For scale, the US spends 3.45% and Japan 3.44%.
Public money already committed
UK Compute Roadmap: public compute to 2030
up to £2bn
Includes over £1bn to expand the AI Research Resource twentyfold and up to £750m for a national supercomputer at Edinburgh (due 2027).
DSIT, UK Compute Roadmap, July 2025, updated 23 April 2026
Sovereign AI Unit
up to £500m
A ceiling, not confirmed spend. Equity cheques of £1m to £10m and up to 1 million GPU hours per start-up.
Sovereign AI Unit, read 21 October 2026
AI Hardware Plan
headline over £1.1bn
The itemised public amounts in the plan do not reconcile to the headline, so no total is shown here.
DSIT, UK AI Hardware Plan, 8 June 2026
R&D tax relief, 2024-25
£8.2bn (provisional)
Cost of the relief across all sectors, not AI alone.
HMRC, R&D tax credits statistics, September 2026, 29 September 2026
Announced is not delivered, and these lines overlap, so they are not added. For scale, private AI investment in the US was $286bn in one year; the lines above are multi-year public commitments, so the two are not a ratio.
Who has proposed what
The proposals disagree. One side argues Britain should fund its own AI capability; another argues it should not try to train frontier models and should focus on using AI well. Both are shown with their authors and no verdict.
Academic · 19 November 2025
Cambridge ai@cam
Current investment risks managed dependence, not sovereignty. Use government as an anchor customer, keep markets contestable, build capacity as well as access, and tie open-source AI to public compute.
Government advisers · 19 October 2026
Council for Science and Technology
Publish a UK AI Sovereignty Plan; keep trusted access to leading models while building capability in selected areas. Advice, not policy.
Academic · 9 July 2026
Oxford Martin AI Governance Initiative
Sovereign control over the compute needed for critical national functions, and an international consortium of middle powers.
Industry (signatories would supply the capacity) · 30 September 2026
Industry open letter, signatories include Cosine, BT and Leonardo
At least £20bn over five years for sovereign compute, power and data-centre capacity, and a ten-year sovereign AI strategy.
Source (reported by a secondary source; the original was not read)
Think tank · July 2025
Tony Blair Institute
Do not try to compete in training frontier models; concentrate on deployment and adoption, faster data-centre planning and links to energy. This is the opposite conclusion on frontier training to the open letter.
Source (reported by a secondary source; the original was not read)
What funding can a UK start-up get?
| Route | What it offers | Who it is for | Status |
|---|---|---|---|
| Sovereign AI Unit | Equity of £1m to £10m, awards or contracts up to £10m, up to 1 million GPU hours per start-up, fast-tracked visas. | British AI start-ups in five priority areas. The page gives no formal criteria or application process. | Running |
| AI Research Resource access | Up to 20,000 GPU hours (Rapid) or 10,000 (Gateway) on the national AI supercomputers. | UK-registered small and medium organisations building AI products (Rapid); academia, industry and first-time users (Gateway). | Open |
| Innovate UK competitions | Competition by competition. On 21 October 2026 one offered up to £1.66m for AI small businesses, closing 18 November 2026. | Set by each competition. | Open, rolling |
| R&D tax relief (merged scheme) | 20% expenditure credit; for loss-making R&D-intensive small companies, a 186% deduction or a 14.5% payable credit. | Companies doing qualifying R&D; the enhanced route needs R&D to be at least 30% of spending. | Live |
| Seed and Enterprise Investment Schemes | Companies can raise up to £250,000 (SEIS) and £10m a year, £24m in a lifetime (EIS) with tax-relieved investors. | Young, small companies within the scheme limits. Investor relief rates are not shown here. | Live |
| Global Talent visa (digital technology) | Fee £766, plus the health surcharge of £1,035 a year per person. | Leaders or potential leaders in digital technology, with endorsement. | Open |
| British Business Bank | Backs venture funds rather than companies. The Hardware Plan names up to £150m for a deep-tech fund. | Start-ups apply to the funds, not the Bank. | Running |
Offers and eligibility are as published on the official pages on 21 October 2026 and change often. Check each page before relying on it.
Proposals to consider. The bodies named below would need to agree to deliver them; responsibility is not a recorded commitment. Follow the links for costs and evidence.
Make cloud exit and continuity work in practice
Test whether a critical service can restore backups, move its data and recover if its cloud provider fails.
Who could deliver it: Service owners, procurement teams and relevant regulators..
Main trade-off and delivery needs
Duplicated cost, security complexity and a nominal exit plan that fails operationally.
Run a costed service-level exercise before buying blanket duplication. No invented national AI-outage loss; retain service-specific risk thresholds.
Cost: The extra cost is not yet known.
Costs, drawbacks and evidence →Turn research into products and adoption
Help research become products that people and businesses use.
Who could deliver it: Business/research departments, UKRI and public buyers.
Main trade-off and delivery needs
Deadweight subsidies; concentrated gains; failed investments.
Separate spinout terms, procurement trials, grants and firm adoption; define market failure, beneficiaries and comparator.
Cost: The extra cost is not yet known.
Costs, drawbacks and evidence →
See all options and what is still unknown →
Some problems have no assessed solution yet: see coverage and gaps.
Domain SWOT
Recorded
Budget 2026 bears on one of these findings
Show the findings
Strengths · 2 findings
Adoption is spreading: 38.1% of firms with ten or more staff used AI in September 2026, against 11.9% in September 2023.
United Kingdom · September 2023 to September 2026
Resilience oversight has begun in one critical sector: Microsoft, Google Cloud, AWS and Oracle were designated critical third parties to the financial system, overseen directly by the Bank of England, PRA and FCA.
United Kingdom (financial services) · Designations effective 13 July 2026
Weaknesses · 4 findings
The NAO’s March 2024 audit identified value-for-money risks from unclear ownership and accountability for government AI adoption. This is a dated audit finding, not evidence that every gap remains unresolved in 2026; pilots and announcements alone do not establish service improvements.
UK central government · March 2024 audit
Resilience also depends on legacy systems and cyber controls. The NAO found significant control gaps and unfunded remediation for many vulnerable systems. AI adoption figures do not measure whether critical services can withstand an attack.
UK central government · NAO audit, January 2025 · risk
Budget 2026 bears on this
Funding to strengthen the UK’s AI security and adoption; the Treasury table does not say how much goes to legacy-system or cyber remediation.
Cloud infrastructure is concentrated: Microsoft and AWS each held 30–40% of UK cloud infrastructure and platform services in 2024 (CMA estimates), and fewer than 1% of customers switch provider in a year.
United Kingdom · 2024
Adoption rates are not outcomes: the main evaluated adoption scheme found no statistically significant effect on productivity.
our synthesis
Opportunities · 1 finding
Tested exit plans for critical workloads, and evaluated AI pilots compared with current processes, would show where AI helps and where dependency is a real risk.
Depends on: Organisations fund realistic exit tests and design evaluations before rollout, with human review time counted.
our synthesis
Threats · 2 findings
Lock-in may persist: the CMA chose provider commitments on egress fees over formal cloud investigations, with a review after six months, so whether switching rises is untested.
risk
Hidden review work, errors and automation bias can cancel out time saved if pilots count throughput but not quality.
risk
Domain action plan
Proposed
Possible steps for government and the bodies responsible. These describe the order of work, not promised dates: starting an action and seeing results take different amounts of time.
Short term · prepare
Identify critical dependencies and gaps in oversight.
Medium term · deliver
Test the linked adoption and continuity proposals.
Long term · judge results
Track useful results and whether services can recover from failures.
Delivery steps and owners (4)
- Prerequisite: Map critical cloud and AI dependencies; set baselines for one service problem · Organisation technology owners; service owners · proposed
- Decision: CMA Board reviews provider commitments on egress fees and interoperability · Competition and Markets Authority · Six months after 31 March 2026 (review timing as announced)
- Delivery: Run an exit-and-restore test and an evaluated AI pilot · Technology owners; service teams; evaluators · proposed
- Result: Tested recovery times; net time, cost and quality from pilots · Organisations; independent evaluators · proposed
Sources, method and changes
Shareable visual summary
Visual summary
The US attracted 48 times more private investment in AI than Britain in 2025.
Private investment in AI companies was $286bn in the US and $5.9bn in the UK in 2025. The UK is still third in the world on this measure and second for newly funded AI companies. Over 2013 to 2025 together the US total was 22 times the UK’s ($757bn against $34bn). Amazon and Microsoft each supplied 30–40% of UK cloud infrastructure and platform services. Cloud share is not a measure of all UK AI or model provision.
CMA, cloud services market investigation (final decision, July 2025, Appendix D, Table D.3): Amazon Web Services and Microsoft each had a 30–40% share of UK cloud infrastructure and platform services combined in 2024. Published as ranges, not points.
Separately: AI adoption
- 38.1%UK businesses with ten or more employees using AI, September 2026
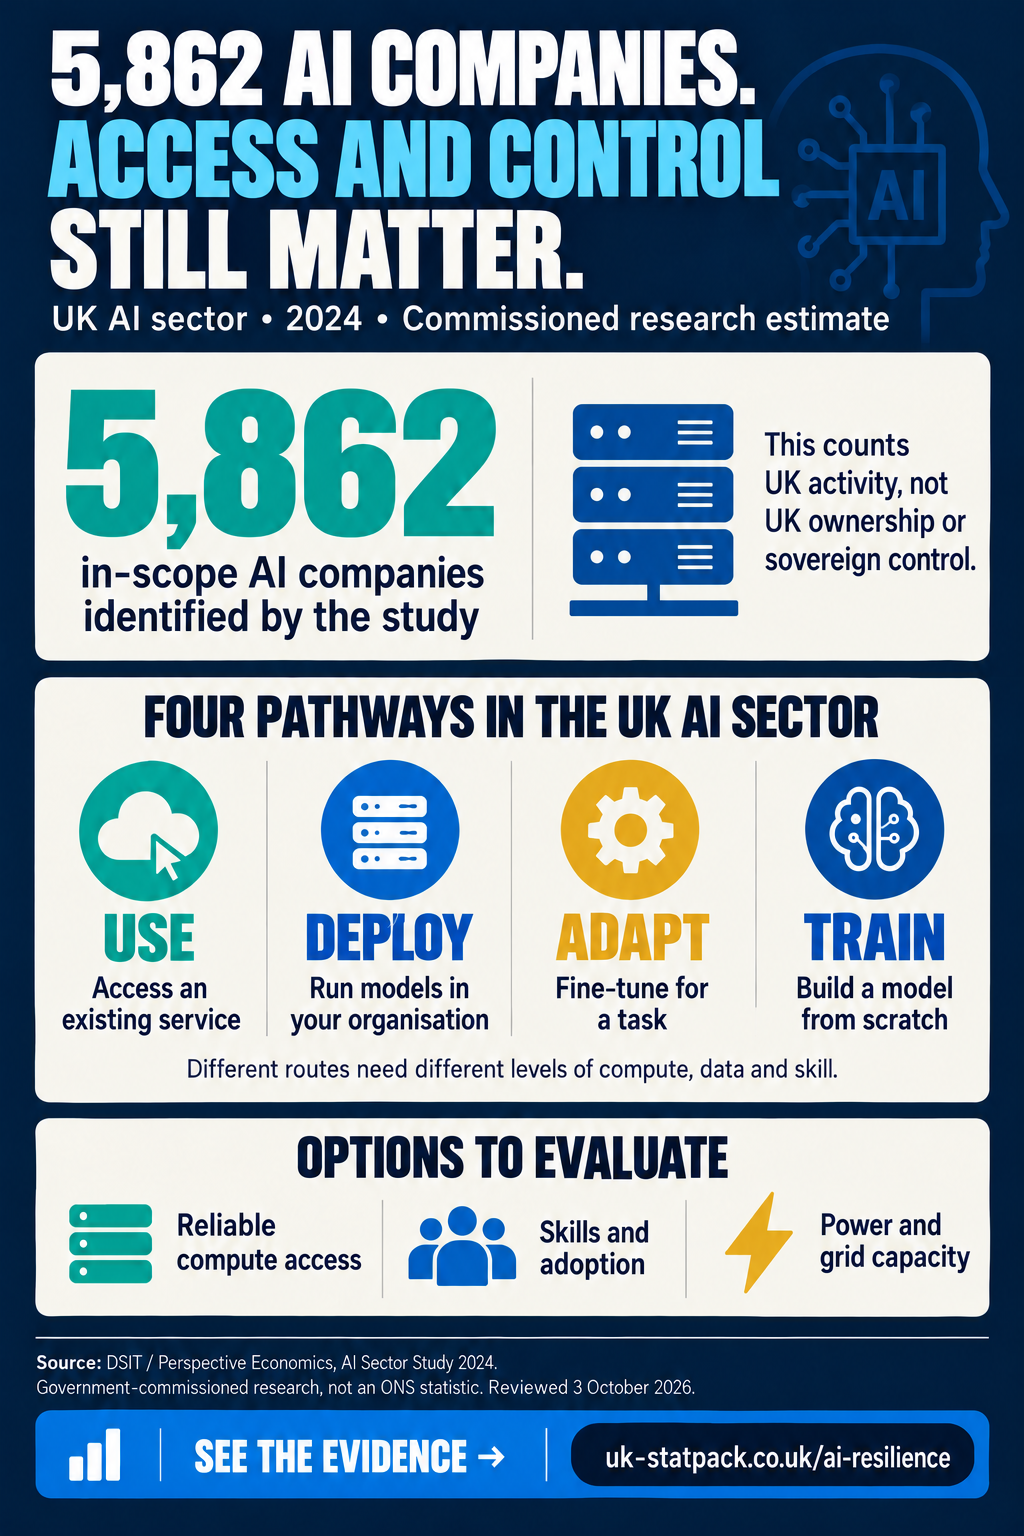
- 5,862in-scope AI companies, 2024 study
Self-reported (ONS BICS). Not a share of all UK businesses.
Text and data version
The US attracted 48 times more private investment in AI than Britain in 2025. Private investment in AI companies was $286bn in the US and $5.9bn in the UK in 2025. The UK is still third in the world on this measure and second for newly funded AI companies. Over 2013 to 2025 together the US total was 22 times the UK’s ($757bn against $34bn). Amazon and Microsoft each supplied 30–40% of UK cloud infrastructure and platform services. Cloud share is not a measure of all UK AI or model provision.
| Measure | Value | Period | Geography | Type | Source |
|---|---|---|---|---|---|
| UK businesses with ten or more employees using AI | 38.1% | September 2026 | United Kingdom | survey estimate | ONS, Business Insights and Conditions Survey wave 165, Figure 1 published AI use |
| In-scope AI companies identified in the UK | 5,862 | 2024 study | United Kingdom | survey estimate | DSIT |
Image description: AI resilience infographic: the AI Sector Study 2024 identified 5,862 AI companies operating in the UK; this is not a measure of ownership or control.
Available images and their source records are listed on Shareable visuals.
Sources and methods (8)
- DSIT, UK Compute Roadmap, Action 1 (released 2025-07-01) — AIRR baseline, target and funding
- BIST/UKRI, AI Research Resource (AIRR): advanced supercomputers for the UK (released updated 28 September 2026) — AIRR facilities and access routes
- CMA, Cloud services market investigation: final decision (released 31 July 2025) — cloud market shares and switching
- CMA, Microsoft’s business software ecosystem: strategic market status investigation (released opened 14 May 2026) — Microsoft strategic market status investigation
- HM Treasury, UK financial system strengthened with new safeguards for major technology providers (released 10 July 2026) — critical third parties designations
- ONS, Business insights and impact on the UK economy: 8 October 2026, Figure 1 downloadable data; BICS wave 165 (21 September–4 October 2026) (released 8 October 2026) — business use of AI
- NESO, Connections reform: retained and prioritised pipeline (released 8 December 2025) — grid connections pipeline
- GOV.UK, Department for Business, Innovation, Science and Trade (organisation page) (released created 20 July 2026) — departmental responsibilities after July 2026
Method notes
- Four tests are kept separate — capability, access, dependency and adoption — and never combined into a score.
- Compute capacity is only compared where units and definitions match. Accelerator counts are hardware counts, not a common performance scale.
- Funding figures for overlapping programmes (the £2bn roadmap, the £1bn+ AIRR component, the £750m Edinburgh system, the £1.1bn+ Hardware Plan) are never added together.