Headline evidence · Energy & bills · Great Britain · Ofgem price cap, dual fuel, direct debit · Oct–Dec 2026

A year of typical energy use costs £1,723, £744 more than in 2021.

A year of typical energy use costs £1,723, which is £744 more than in 2021. After inflation it is roughly a third more. Electricity has no VAT from October 2026 to March 2027.

Proposed outcome: Compare ways to lower energy costs for homes and businesses. What could change →

Geography
Great Britain, dual fuel, direct debit
Evidence period
Apr–Sep 2021 vs Oct–Dec 2026
Evidence status
Site calculation from published data
Editorial review
Reviewed 21 October 2026

The short version

Three key measures

  • How much more does typical use cost than in 2021?

    +£744a year, in cash

    A year of typical energy use costs £744 more than in 2021. This is not a maximum bill: use more and you pay more.

    Great Britain, dual fuel, direct debit · Apr–Sep 2021 vs Oct–Dec 2026 · Site calculation from published data

    Definition, limits and source: How much more does typical use cost than in 2021?

    £979 a year at Apr–Sep 2021 cap rates — Ofgem’s like-for-like recalculation at today’s typical consumption, not the cap figure published in 2021 — and £1,723 at Oct–Dec 2026 rates, for the same typical consumption (2,500 kWh electricity, 9,500 kWh gas a year). Cash terms, not adjusted for inflation; up from £1,663 in Jul–Sep 2026. A benchmark — not a maximum bill, and not anyone’s actual bill.

    Site calculation from published data · Ofgem, Energy price cap (default tariff) levels — Annex 9, levelised cap levels, sheet 1c 'Consumption adjusted levels', Other Payment Method (direct debit)

    Try it with your own usage →
  • After inflation, is energy still dearer than before the crisis?

    +35%after inflation

    Energy remained dearer even after allowing for other price rises. This comparison ends in the same period as the cash figure.

    Great Britain cap; UK CPI · Apr–Sep 2021 vs Oct–Dec 2026

    Definition, limits and source: After inflation, is energy still dearer than before the crisis?

    The cap at typical use in Oct–Dec 2026 was £1,723 in Sep 2026 prices (the latest month with published consumer prices), against £1,281 for Apr–Sep 2021 in the same prices. Same consumption basis and the same end period as the cash comparison; CPI-adjusted by UK Facts. From 1 October 2026 to 31 March 2027 there is no VAT on electricity (Ofgem put this at about £45 a year at typical use), which lowers both the cash and the real-terms figures for those months.

    Site calculation from published data · ONS, Consumer price inflation (MM23), series D7BT (all items), D7DT (electricity), D7DU (gas)

    Bills since 2019, cash and real →
  • Survey-based evidence
    DESNZ Public Attitudes TrackerFieldwork: Spring 2026UK adults 16+, 3,380 in spring 2026. Estimates have sampling uncertainty (about 1 point).

    How many adults have gone without heating because of energy bills?

    22%of adults cut heating

    About one adult in five said they had cut heating or power to an uncomfortable level because of energy bills. One in twenty had also skipped meals.

    United Kingdom, adults 16+ · Spring 2026

    Definition, limits and source: How many adults have gone without heating because of energy bills?

    22% of UK adults said in spring 2026 that they had cut electricity or heating to an uncomfortable level in recent months because of the cost of their energy bills; 10% had skipped meals and 5% had done both. It records what people did, not a choice between the two.

    Survey-based · DESNZ Public Attitudes Tracker, 2021-2026, COSTACTIONS02 and COSTACTIONS05

    Food banks and food insecurity →
Who feels this most?

The same rates land very differently. Standing charges of £308 a year are a bigger share of a small bill, and a poorly insulated home needs more kWh for the same warmth. In England, 9.4% of households — 2.36 million — were estimated to be fuel poor in 2025, with an average gap of £379 between their energy costs and what would take them out of fuel poverty.

Budget 2026 · 28 October 2026

What the Budget means for energy

9

Budget measures on this topic

£3.3bn

Net cost, 2026–27

£705m

Net cost, 2029–30

Biggest single-year effect of each measure · red costs money, teal saves or raises it

  • Household Energy Payment2026–27−£2.6bn
  • Industrial Electricity2027–28−£1.2bn
  • Support for Energy Bills2026–27−£755m
  • Emissions Trading Scheme (ETS)2029–30−£490m
  • Carbon Price Support (CPS)2028–29−£165m
  • Electricity Generator Levy2026–27+£60m
All 9 measures on this topic
The Budget in 2 minutes →Is it being delivered? →

Treasury costings certified by the OBR, not measured results. Topic links are UK Facts’ classification.

The evidence

Living-cost concern is context for energy affordability, not an energy-specific satisfaction measure or support for a particular policy.

Going cold, skipping meals

Survey-based evidence
DESNZ Public Attitudes TrackerFieldwork: Spring 2026UK adults 16+ (3,380 in spring 2026). Asked which actions they had taken in recent months because of the cost of their energy bills. Estimates have sampling uncertainty (about 1 point).

In spring 2026, about one adult in five (22%) said they had cut electricity or heating to an uncomfortable level because of the cost of their energy bills. About one in ten (10%) had skipped meals, and one in twenty (5%) had done both. The survey records actions, not a choice between heat and food, so we do not describe it as people “choosing”. The share who cut heating was 27% in spring 2023; the wording of the question changed slightly in 2026.

Share of adults taking each action because of energy-bill costs, Spring 2026 and Spring 2023.

  • Cut heating, Spring 202622% of adults
  • Cut heating, Spring 202327% of adults
  • Skipped meals, Spring 202610% of adults
  • Skipped meals, Spring 202311% of adults
  • Both, Spring 20265% of adults
  • Both, Spring 20237% of adults

Food banks, food insecurity and what could reduce them →

DESNZ Public Attitudes Tracker, 2021-2026, UK Data Service study 9568. Actions the respondent links to the cost of energy bills; not a general food-insecurity measure. The wave 16 question stem omits the words "the increase in".

How do UK energy prices compare abroad?

For big industrial users the UK pays the most of 15 European countries for electricity: more than twice the middle price. UK household gas, by contrast, is among the cheapest of those countries. We could not build a like-for-like comparison with the US, Japan, Canada or China: the official UK tables that once covered them were withdrawn under licence terms, so we do not say the UK is the highest in the G7.

Large industrial users

20,000 to 69,999 MWh a year

  • United Kingdom23.4p
  • Ireland17.2p
  • Germany13.9p
  • Median of 14 EU countries plus UK10.2p
  • France7.4p
  • Finland4.4p

UK is 130% above the median.

Very large industrial users

70,000 to 150,000 MWh a year

  • United Kingdom21.8p
  • Ireland15.0p
  • Germany12.5p
  • Median of 14 EU countries plus UK10.5p
  • France6.2p
  • Finland3.7p

UK is 108% above the median.

Pence per kWh including taxes and charges for environmental and social policies, excluding VAT, Jul – Dec, 2025 (DESNZ, from Eurostat; sterling at the exchange rate when published). These are bands for big industrial users, not a data-centre tariff, and there is no like-for-like US figure. Price is one constraint; grid connection dates of several years are another, and the evidence does not show that any particular data centre was not built because of price.

Source: DESNZ, Quarterly Energy Prices, table 5.4 (Eurostat). The US publishes its own prices in cents per kWh on different customer definitions, which cannot be converted fairly to these bands. This matters for AI and data centres: see Technology.

Where the electricity comes from

In 1996 coal supplied more than two-fifths of UK electricity and nuclear more than a quarter. In 2025 coal had almost gone, wind and solar supplied more than a third, gas about a third and nuclear about an eighth. The carbon in each unit of electricity supplied fell from 521 grams to 147 grams of CO₂ per kWh. Nuclear output has fallen by well over half as stations closed.

UK electricity generation by fuel, 1996 to 2025, terawatt-hours. Coal fell from 145 to 0; wind rose from 0 to 86; nuclear fell from 95 to 36.01002003004001996 Coal: 145.2 TWh1996 Gas: 84.1 TWh1996 Nuclear: 94.7 TWh1996 Wind: 0.5 TWh1996 Solar: 0.0 TWh1996 Bioenergy and hydro: 5.6 TWh1997 Coal: 119.7 TWh1997 Gas: 111.0 TWh1997 Nuclear: 98.1 TWh1997 Wind: 0.7 TWh1997 Solar: 0.0 TWh1997 Bioenergy and hydro: 6.8 TWh1998 Coal: 123.0 TWh1998 Gas: 117.8 TWh1998 Nuclear: 99.5 TWh1998 Wind: 0.9 TWh1998 Solar: 0.0 TWh1998 Bioenergy and hydro: 8.4 TWh1999 Coal: 106.2 TWh1999 Gas: 142.9 TWh1999 Nuclear: 95.1 TWh1999 Wind: 0.8 TWh1999 Solar: 0.0 TWh1999 Bioenergy and hydro: 9.3 TWh2000 Coal: 120.0 TWh2000 Gas: 148.1 TWh2000 Nuclear: 85.1 TWh2000 Wind: 0.9 TWh2000 Solar: 0.0 TWh2000 Bioenergy and hydro: 9.4 TWh20002001 Coal: 131.5 TWh2001 Gas: 141.9 TWh2001 Nuclear: 90.1 TWh2001 Wind: 1.0 TWh2001 Solar: 0.0 TWh2001 Bioenergy and hydro: 9.1 TWh2002 Coal: 124.3 TWh2002 Gas: 152.3 TWh2002 Nuclear: 87.8 TWh2002 Wind: 1.3 TWh2002 Solar: 0.0 TWh2002 Bioenergy and hydro: 10.4 TWh2003 Coal: 138.3 TWh2003 Gas: 148.9 TWh2003 Nuclear: 88.7 TWh2003 Wind: 1.3 TWh2003 Solar: 0.0 TWh2003 Bioenergy and hydro: 9.9 TWh2004 Coal: 131.8 TWh2004 Gas: 157.1 TWh2004 Nuclear: 80.0 TWh2004 Wind: 1.9 TWh2004 Solar: 0.0 TWh2004 Bioenergy and hydro: 12.8 TWh2005 Coal: 134.6 TWh2005 Gas: 152.6 TWh2005 Nuclear: 81.6 TWh2005 Wind: 2.9 TWh2005 Solar: 0.0 TWh2005 Bioenergy and hydro: 14.6 TWh20052006 Coal: 148.8 TWh2006 Gas: 140.8 TWh2006 Nuclear: 75.5 TWh2006 Wind: 4.2 TWh2006 Solar: 0.0 TWh2006 Bioenergy and hydro: 14.5 TWh2007 Coal: 135.9 TWh2007 Gas: 165.8 TWh2007 Nuclear: 63.0 TWh2007 Wind: 5.3 TWh2007 Solar: 0.0 TWh2007 Bioenergy and hydro: 14.4 TWh2008 Coal: 124.4 TWh2008 Gas: 176.2 TWh2008 Nuclear: 52.5 TWh2008 Wind: 7.1 TWh2008 Solar: 0.0 TWh2008 Bioenergy and hydro: 14.7 TWh2009 Coal: 103.0 TWh2009 Gas: 166.5 TWh2009 Nuclear: 69.1 TWh2009 Wind: 9.3 TWh2009 Solar: 0.0 TWh2009 Bioenergy and hydro: 15.9 TWh2010 Coal: 107.6 TWh2010 Gas: 175.7 TWh2010 Nuclear: 62.1 TWh2010 Wind: 10.3 TWh2010 Solar: 0.0 TWh2010 Bioenergy and hydro: 15.9 TWh20102011 Coal: 108.4 TWh2011 Gas: 146.5 TWh2011 Nuclear: 69.0 TWh2011 Wind: 16.0 TWh2011 Solar: 0.2 TWh2011 Bioenergy and hydro: 19.0 TWh2012 Coal: 142.8 TWh2012 Gas: 100.2 TWh2012 Nuclear: 70.4 TWh2012 Wind: 19.8 TWh2012 Solar: 1.4 TWh2012 Bioenergy and hydro: 20.0 TWh2013 Coal: 130.3 TWh2013 Gas: 95.8 TWh2013 Nuclear: 70.6 TWh2013 Wind: 28.4 TWh2013 Solar: 2.0 TWh2013 Bioenergy and hydro: 22.8 TWh2014 Coal: 100.2 TWh2014 Gas: 100.9 TWh2014 Nuclear: 63.7 TWh2014 Wind: 32.0 TWh2014 Solar: 4.1 TWh2014 Bioenergy and hydro: 28.5 TWh2015 Coal: 75.9 TWh2015 Gas: 99.9 TWh2015 Nuclear: 70.3 TWh2015 Wind: 40.3 TWh2015 Solar: 7.5 TWh2015 Bioenergy and hydro: 35.6 TWh20152016 Coal: 30.7 TWh2016 Gas: 143.4 TWh2016 Nuclear: 71.7 TWh2016 Wind: 37.2 TWh2016 Solar: 10.4 TWh2016 Bioenergy and hydro: 35.4 TWh2017 Coal: 22.5 TWh2017 Gas: 136.7 TWh2017 Nuclear: 70.3 TWh2017 Wind: 49.6 TWh2017 Solar: 11.5 TWh2017 Bioenergy and hydro: 37.8 TWh2018 Coal: 16.8 TWh2018 Gas: 131.5 TWh2018 Nuclear: 65.1 TWh2018 Wind: 56.9 TWh2018 Solar: 12.7 TWh2018 Bioenergy and hydro: 40.5 TWh2019 Coal: 6.9 TWh2019 Gas: 133.1 TWh2019 Nuclear: 56.2 TWh2019 Wind: 63.8 TWh2019 Solar: 12.4 TWh2019 Bioenergy and hydro: 43.5 TWh2020 Coal: 5.7 TWh2020 Gas: 111.9 TWh2020 Nuclear: 50.2 TWh2020 Wind: 75.6 TWh2020 Solar: 12.5 TWh2020 Bioenergy and hydro: 45.4 TWh20202021 Coal: 6.8 TWh2021 Gas: 122.8 TWh2021 Nuclear: 46.1 TWh2021 Wind: 64.9 TWh2021 Solar: 12.1 TWh2021 Bioenergy and hydro: 45.4 TWh2022 Coal: 5.9 TWh2022 Gas: 125.8 TWh2022 Nuclear: 47.4 TWh2022 Wind: 80.2 TWh2022 Solar: 14.0 TWh2022 Bioenergy and hydro: 41.0 TWh2023 Coal: 3.7 TWh2023 Gas: 101.7 TWh2023 Nuclear: 40.6 TWh2023 Wind: 82.8 TWh2023 Solar: 14.9 TWh2023 Bioenergy and hydro: 39.7 TWh2024 Coal: 2.0 TWh2024 Gas: 87.4 TWh2024 Nuclear: 40.6 TWh2024 Wind: 83.6 TWh2024 Solar: 15.0 TWh2024 Bioenergy and hydro: 45.9 TWh2025 Coal: 0.0 TWh2025 Gas: 93.2 TWh2025 Nuclear: 35.9 TWh2025 Wind: 86.4 TWh2025 Solar: 20.1 TWh2025 Bioenergy and hydro: 46.4 TWh2025TWh generated in the UK
  • Coal
  • Gas
  • Nuclear
  • Wind
  • Solar
  • Bioenergy and hydro
View the figures as a table
TWh generated in the UK. Oil and other small fuels are not shown.
YearCoalGasNuclearWindSolarBioenergy and hydro
1996145.284.194.70.50.05.6
1997119.7111.098.10.70.06.8
1998123.0117.899.50.90.08.4
1999106.2142.995.10.80.09.3
2000120.0148.185.10.90.09.4
2001131.5141.990.11.00.09.1
2002124.3152.387.81.30.010.4
2003138.3148.988.71.30.09.9
2004131.8157.180.01.90.012.8
2005134.6152.681.62.90.014.6
2006148.8140.875.54.20.014.5
2007135.9165.863.05.30.014.4
2008124.4176.252.57.10.014.7
2009103.0166.569.19.30.015.9
2010107.6175.762.110.30.015.9
2011108.4146.569.016.00.219.0
2012142.8100.270.419.81.420.0
2013130.395.870.628.42.022.8
2014100.2100.963.732.04.128.5
201575.999.970.340.37.535.6
201630.7143.471.737.210.435.4
201722.5136.770.349.611.537.8
201816.8131.565.156.912.740.5
20196.9133.156.263.812.443.5
20205.7111.950.275.612.545.4
20216.8122.846.164.912.145.4
20225.9125.847.480.214.041.0
20233.7101.740.682.814.939.7
20242.087.440.683.615.045.9
20250.093.235.986.420.146.4
Source: DESNZ, Digest of UK Energy Statistics 2026, chapter 5. Nuclear output is 62% lower than in 1996, as stations closed. Generation is not the same as the electricity supplied: the UK also imports power.
Grams of CO₂ per kWh0g200g400g600g200020102020Now 147g

The UK mix against the G7

France relies on nuclear and Canada on hydro. The UK’s electricity is 64% low carbon, behind France and Canada and ahead of Germany, Italy, the US and Japan. Cheap, clean power and cheap power are not the same thing: prices also reflect gas, networks and policy charges.

  • France95% low carbon
  • Canada76% low carbon
  • United Kingdom64% low carbon
  • Germany58% low carbon
  • Italy49% low carbon
  • United States43% low carbon
  • Japan33% low carbon
  • Coal
  • Gas
  • Other fossil
  • Nuclear
  • Wind and solar
  • Hydro, bioenergy and other
Share of each country’s electricity generation, 2025 (Ember yearly electricity data). Low carbon is everything except coal, gas and other fossil fuels. Electricity is a part of energy use: heating and transport still rely heavily on gas and oil. China is not in the data set held here.

Energy cost and the technology gap

AI and data centres need a great deal of reliable, affordable power. High industrial electricity prices and grid connection dates running to several years are both cited as barriers to building them in Britain, and the government has offered AI Growth Zones a discount of £14 to £24 per MWh from April 2027, subject to legislation. The evidence shows the constraint; it does not show how many projects it has stopped. Compute and the price of power, on the Technology page →

Annual data: Electricity prices and general inflation over 30 years

The 1996–2026 window shows published annual indices through 2025; no complete 2026 annual value is available. The Energy Price Guarantee reduced measured prices in 2022–23; the separate £400 support payment did not. The price cap began in 2019 and has no 1996 baseline. A dash means no comparable observation is supplied; it is not zero. United Kingdom consumer prices across tariffs and payment methods. These are price indices, not household bills or the Great Britain default-tariff cap.

1996–2026; Annual CPI index, 2015 = 100. No change is calculated across definition or assessment breaks.

Electricity prices and general inflation over 30 years; Annual CPI index, 2015 = 100
YearElectricityAll items
199648.768.8
199746.370.1
199844.271.2
199943.772.1
200042.872.7
200142.473.6
200242.674.5
20034375.5
200445.676.5
200550.478.1
200661.479.9
200766.381.8
200876.684.7
200980.186.6
201078.189.4
201183.893.4
201288.596.1
201395.198.5
2014100.3100
2015100100
201699.8100.7
2017106.5103.4
2018115.7105.9
2019124.1107.8
2020124.3108.7
2021132.5111.6
2022197.5121.7
2023224.6130.5
2024190.5133.9
2025192.8138.4
2026No comparable observations supplied

What households pay now

The cap sets a maximum price for each kilowatt-hour and a maximum daily standing charge on default tariffs. Ofgem’s headline £1,723 is those rates applied to 2,500 kWh of electricity and 9,500 kWh of gas — Ofgem’s typical use since July 2026. In Ofgem’s words, the cap sets “maximum prices, not maximum bills”. Change the usage below and the bill moves while the rates do not.

What would a year of energy cost at the capped rates?

The cap limits rates, not your total bill

Great Britain average (England, Scotland, Wales); not Northern Ireland · Jan–Mar 2019 to Oct–Dec 2026
Typical: 2,500 kWh · 26.32p per kWh
Typical: 9,500 kWh · 7.97p per kWh

Annual cost at these rates

£1,723 a year

The arithmetic

Electricity: 2,500 kWh × 26.32p = £658

Gas: 9,500 kWh × 7.97p = £757

Standing charges: (54.83p + 29.68p) × 365 days = £308

Total: £1,723 a year (rounded to the nearest pound, including VAT)

The cap limits prices per unit, not your total bill. You pay more when you use more, plus a daily standing charge. Prices also vary by region.

Great Britain average (England, Scotland, Wales); not Northern Ireland · Jan–Mar 2019 to Oct–Dec 2026 · Official cap rates; the annual cost is an illustration, not a supplier quote

Show the workings — The cap limits rates, not your total bill

Annual cost = standing charges × 365 days + unit rate × kWh used, at Ofgem’s direct-debit cap rates for the chosen period. Starts at Ofgem’s typical consumption: 2,500 kWh of electricity and 9,500 kWh of gas a year.

Double the electricity you use and the unit-rate part of the bill doubles, though the capped rate has not changed. The standing charges — £308 a year for a dual-fuel home on direct debit — are paid however little you use. That is why the cap’s headline figure describes no particular household: it is the cap’s rates applied to one assumed level of use. The main limit is geography: these are GB averages, and the rates in your region differ.

Geography:
Great Britain average (England, Scotland, Wales); not Northern Ireland — Default (standard variable) tariffs, paid by direct debit, single-rate electricity meter
Measure:
£ a year, including VAT; rates in pence per kWh and pence per day
Period:
Jan–Mar 2019 to Oct–Dec 2026
Status:
Official cap rates; the annual cost is an illustration, not a supplier quote
Calculation:
Unit rates and standing charges are derived exactly from Ofgem’s published nil- and typical-consumption cap levels (level = standing charge × 365 + unit rate × kWh); they reproduce Ofgem’s quoted rates to the penny. The annual cost is that formula applied to the usage you enter.
Compare with:
The same rates at Ofgem’s typical consumption: £1,723 a year for Oct–Dec 2026
Not included / breaks:
Regional rates differ from the GB average, and prepayment and standard-credit caps are set at different levels; neither is held here yet. Fixed tariffs and Economy 7 meters are outside this cap. From October 2022 to June 2023 households were charged lower Energy Price Guarantee rates, and the £400 Energy Bills Support Scheme discount is not deducted.

Source: Ofgem, Energy price cap (default tariff) levels — Annex 9, levelised cap levels, sheet 1c 'Consumption adjusted levels', Other Payment Method (direct debit) (released 26 August 2026).

View the data as a table
Cap periodElectricity p/kWhElectricity p/dayGas p/kWhGas p/dayAt 2,500/9,500 kWh, £/yr
Jan–Mar 201916.5222.773.7325.82945
Apr–Sep 201918.5623.424.1426.521039
Oct 2019–Mar 202017.8523.513.6826.71979
Apr–Sep 202017.8124.383.5027.35967
Oct 2020–Mar 202117.1924.383.0026.07899
Apr–Sep 202118.9524.893.3426.60979
Oct 2021–Mar 202220.8024.884.0726.121093
Apr–Sep 202228.3445.347.3727.221673
Oct–Dec 2022 (EPG applied)51.8946.3614.7628.482972
Jan–Mar 2023 (EPG applied)67.4746.3617.0828.483582
Apr–Jun 2023 (EPG applied)50.6052.9712.6129.112762
Jul–Sep 202330.1152.977.5129.111766
Oct–Dec 202327.3553.376.8929.621641
Jan–Mar 202428.6253.357.4229.601723
Apr–Jun 202424.5060.106.0431.431520
Jul–Sep 202422.3660.125.4831.411414
Oct–Dec 202424.5060.996.2431.661543
Jan–Mar 202524.8660.976.3431.651561
Apr–Jun 202527.0353.806.9932.671655
Jul–Sep 202525.7351.376.3329.821541
Oct–Dec 202526.3553.686.2934.031576
Jan–Mar 202627.6954.755.9335.091584
Apr–Jun 202624.6757.215.7429.091477
Jul–Sep 202626.1157.197.3329.041663
Oct–Dec 202626.3254.837.9729.681723

Scroll the table sideways to see every column.

What happens to the cap next?

The cap for October to December 2026 is confirmed: £1,723 a year at Ofgem’s typical use in Great Britain. The level for January to March 2027 has not been set. Ofgem will announce it by 25 November 2026; until then its size is not known.

A source behind this section is overdue or failed its latest check. The figures shown are the last ones verified, with their original dates.

  • Now: October to December 2026

    Confirmed

    £1,723 a year

    A limit on unit rates and standing charges, shown as a year’s bill at typical use. Use more and you pay more.

    Great Britain · Direct Debit · 2,500 kWh of electricity and 9,500 kWh of gas a year · Ofgem, Annex 9, announced 26 August 2026

  • Change from July to September 2026

    Confirmed

    +£60 a year

    Not a like-for-like price change: there is no VAT on electricity from 1 October 2026 to 31 March 2027, so the two periods are taxed differently. Before VAT the cap rose from £1,584 to £1,682 (+6.2%). Ofgem says costs cannot be compared directly.

    Same payment method and typical use in both periods · +3.6% · about £5 a month if spread evenly over a year

  • Next: January to March 2027

    Expected date

    Not yet announced

    UK Facts shows a cap level only once Ofgem has confirmed it.

    Announcement due by 25 November 2026 · Ofgem’s published dates · Ofgem may publish earlier

Why it could move. Wholesale energy is the largest part of the cap, and Ofgem takes wholesale prices into account each quarter (Ofgem). It sets each level about five weeks before the period starts (26 August 2026 for October to December 2026). Where a bill goes shows the wholesale share. Until Ofgem announces a level, any figure for it is a forecast.

Independent forecasts. Analysts publish their own estimates of the next cap; Cornwall Insight published one on 30 September 2026. UK Facts does not have permission to republish its figures, so none appears here. That is a rights position, not a missing forecast.

Household costs outlook: energy, food, pay and borrowing together →

Insulation needs verified installation and repairs

The 2025 ECO4/GBIS audit estimated major or Category 1 defects in 98% of external-wall installations (95% interval 96–99%) and 29% of internal-wall installations (25–34%). These estimates concern the schemes’ previously unaudited installations, not all insulated homes.

Audit method and delivery status

Chartered surveyors inspected random samples of 378 external and 380 internal installations from populations of 24,600 and 36,100. Around 3,800 households were contacted; nonresponse and replacement sampling matter. DESNZ/Ofgem results and method.

ECO4 was extended to 31 December 2026 for existing obligations and remediation; GBIS ended on 31 March 2026. This is additional time, not evidence that repairs are complete. Government response.

Has the energy shock passed?

The energy shock eased, but the comparable bill remains above its earlier level

Great Britain average · Jan–Mar 2019 to Oct–Dec 2026

1996–2026 · recorded figures. Shading marks years without figures: this series starts in 2019.

£ a year, cash, at typical useSeries starts 2019£0£1,000£2,000£3,000£4,000200020102020£1,723

Energy costs have fallen from their peak but remain well above 2021. Government support reduced what households paid during the peak. The inflation-adjusted comparison covers the same period as the cash comparison.

Great Britain average · Jan–Mar 2019 to Oct–Dec 2026 · Official statistics; latest period provisional

Show the workings — The energy shock eased, but the comparable bill remains above its earlier level

Ofgem’s cap for a dual-fuel direct-debit household, restated by Ofgem for every period at one consumption (2,500 kWh electricity, 9,500 kWh gas), £ a year in cash terms. Each step is one cap period.

On a like-for-like basis the cap rose from £979 in Apr–Sep 2021 to a peak of £3,582 in Jan–Mar 2023, then fell back. It has not returned: at £1,723 it is 76% above the 2021 level in cash terms. During the peak, the government’s price guarantee held what households were actually charged well below the cap. The figures above are cash amounts through Oct–Dec 2026. The inflation-adjusted comparison ends in the same period, Oct–Dec 2026: about 35% above Apr–Sep 2021, in Sep 2026 prices (the latest month with published consumer prices).

Geography:
Great Britain average — Default tariffs, direct debit
Measure:
£ a year, cash (nominal), including VAT
Period:
Jan–Mar 2019 to Oct–Dec 2026
Status:
Official statistics; latest period provisional
Calculation:
As published by Ofgem on its latest consumption basis; drawn as steps because the cap is fixed within each period (six-monthly to September 2022, quarterly since).
Compare with:
Apr–Sep 2021, before wholesale gas prices surged: £979
Not included / breaks:
Cash terms — see the real-terms chart on the bill history page. The shaded period is when the Energy Price Guarantee set lower prices than the cap, so households did not pay the cap. The £400 Energy Bills Support Scheme discount (October 2022–March 2023) is not deducted. These comparable figures differ from the ones Ofgem announced at the time, which used older, higher consumption assumptions (both are in the table).

Source: Ofgem, Energy price cap (default tariff) levels — Annex 9, levelised cap levels, sheet 1c 'Consumption adjusted levels', Other Payment Method (direct debit) (released 26 August 2026).

View the data as a table
Cap periodComparable basis, £/yrAs announced at the time, £/yr
Jan–Mar 20199451137
Apr–Sep 201910391254
Oct 2019–Mar 20209791179
Apr–Sep 20209671126
Oct 2020–Mar 20218991042
Apr–Sep 20219791138
Oct 2021–Mar 202210931277
Apr–Sep 202216731971
Oct–Dec 202229723549
Jan–Mar 202335824279
Apr–Jun 202327623280
Jul–Sep 202317662074
Oct–Dec 202316411834
Jan–Mar 202417231928
Apr–Jun 202415201690
Jul–Sep 202414141568
Oct–Dec 202415431717
Jan–Mar 202515611738
Apr–Jun 202516551849
Jul–Sep 202515411720
Oct–Dec 202515761755
Jan–Mar 202615841758
Apr–Jun 202614771641
Jul–Sep 202616631663
Oct–Dec 202617231723

Where a bill goes

Where does a capped bill go?

Wholesale energy is 45% of the typical capped bill; networks 24%

Great Britain average · Oct–Dec 2026
  • Wholesale energy£774 (45%)
  • Networks£417 (24%)
  • Supplier operating costs£204 (12%)
  • Policy costs£96 (6%)
  • Bad debt£52 (3%)
  • Supplier profit allowance£46 (3%)
  • VAT£41 (2%)
  • Capacity Market£38 (2%)
  • Industry charges£35 (2%)
  • Headroom£18 (1%)
  • Levelisation£8 (0%)
  • Smart meter roll-out (net)−£7 (a saving, not drawn)

Buying energy and maintaining the networks make up most of the capped bill. Moving costs from bills to tax changes who pays; it does not make the costs disappear.

Great Britain average · Oct–Dec 2026 · Official allowances, not audited costs

Show the workings — Wholesale energy is 45% of the typical capped bill; networks 24%

The cost allowances Ofgem uses to build the cap for Oct–Dec 2026, dual fuel at typical consumption, direct debit, £ a year.

Two parts dominate: buying the energy, and the networks that carry it. Wholesale energy is the part that moved most in the crisis and still moves with international gas prices. Network costs are set by Ofgem’s price controls for the wires and pipes and change more slowly; on this basis they have roughly doubled since 2019. Policy costs fell in April 2026 when the government moved most Renewables Obligation costs to taxation and removed ECO4 and Great British Insulation Scheme allowances from domestic tariffs. Existing ECO4 delivery and remediation obligations continue to 31 December 2026. Read these as allowances, not as audited spending.

Geography:
Great Britain average — Default tariffs, direct debit, typical consumption
Measure:
£ a year, cash; components excluding VAT, with VAT shown separately
Period:
Oct–Dec 2026
Status:
Official allowances, not audited costs
Calculation:
As published by Ofgem (each component line of sheet 1c). Components sum to £1,723 against the published total of £1,723; any difference is rounding in Ofgem’s tables.
Compare with:
Total cap at typical use, £1,723
Not included / breaks:
These are what Ofgem allows an efficient supplier to recover, not a record of where any company’s money went. VAT on electricity is 0% from 1 October 2026, so the VAT line is smaller than in earlier periods.

Source: Ofgem, Energy price cap (default tariff) levels — Annex 9, levelised cap levels, sheet 1c 'Consumption adjusted levels', Other Payment Method (direct debit) (released 26 August 2026).

View the data as a table
Component£ a yearShare of totalWhat it pays for
Wholesale energy773.9844.9%Buying gas and electricity on the wholesale market, including hedging.
Networks417.3424.2%Building, running and paying a regulated return on the transmission and distribution wires and pipes.
Supplier operating costs203.9411.8%Billing, customer service, metering and other running costs.
Policy costs96.395.6%Government schemes funded through bills, such as the Renewables Obligation, feed-in tariffs and the Warm Home Discount.
Bad debt51.793.0%Allowance for unpaid bills and the cost of collecting debt.
Supplier profit allowance45.722.7%Earnings before interest and tax that Ofgem allows an efficient supplier — an allowance, not a measured profit.
Capacity Market38.442.2%Payments to keep enough power stations and storage available for peak demand.
Industry charges35.292.0%Charges for industry bodies and systems.
Headroom18.131.1%A margin for uncertainty in Ofgem’s estimates.
Levelisation8.050.5%Redistribution that evens out standing charges between payment methods.
Smart meter roll-out (net)-6.93-0.4%Net change in supplier costs from the smart meter roll-out; can be negative.
VAT41.202.4%Value added tax on domestic energy.

Scroll the table sideways to see every column.

Gas, generation, networks and policy costs

Gas prices influence electricity prices too. Network charges pay for the wires and pipes. Some policy costs moved from bills to taxation in April 2026.

Where each part of the bill goes

Wholesale energy (£774) follows the international gas price. Gas plants made under half of the UK’s electricity in 2021 but set the wholesale power price almost all of the time, so a gas shock raises electricity prices too. Networks (£417, up from £209 in Jan–Mar 2019) pay for the wires and pipes under Ofgem’s price controls. Policy costs fell to £96 in April 2026 when most Renewables Obligation costs moved to taxation. How each part has changed since 2019.

Who owns which part of the system?

Part of the systemShare of the typical billHow it is organised
Generation and wholesale energy£774Competitive market. Companies include UK-listed groups and UK subsidiaries of overseas parents; many low-carbon projects sell power under government-backed contracts.
Networks (wires and pipes)£417Regional monopolies owned by private investors; Ofgem sets what they may earn in multi-year price controls.
System operationwithin networks and industry chargesThe National Energy System Operator, publicly owned since 1 October 2024.
Supply (your energy company)£250Competitive retail market; the cap allows an efficient supplier its operating costs and a profit allowance of £46.

Supply share = operating costs plus profit allowance; bad debt, headroom and other lines are excluded. Every company, checked against the Companies House register.

Rates for Oct–Dec 2026: electricity 26.32p/kWh and 54.83p/day; gas 7.97p/kWh and 29.68p/day (GB average, direct debit).

Why it is happening

Our analysis

World energy prices and network costs drive much of the bill. Better-insulated homes can use less energy, but improvements need skilled installers and someone to pay the upfront cost.

Read the options, evidence and limits below.

Who is affected most

Who feels this most?

Who is most likely to be in fuel poverty?

Prepayment customers, homes off the gas grid and private renters are about twice as likely as average to be fuel poor

England only (fuel poverty is measured differently in Scotland, Wales and Northern Ireland) · 2025 (projection from 2024 final estimates)
2025England 9.4%
  • Pays electricity by prepayment meter17.9%
  • Off the gas grid17.7%
  • Private renters17.2%
  • Pays electricity by standard credit (on receipt of bill)12.7%
  • Social renters12.0%
  • Pays electricity by direct debit8.1%
  • On the gas grid8.0%
  • Owner occupiers who own outright6.6%
  • Owner occupiers with a mortgage6.5%

Low incomes and poorly insulated homes make heating harder to afford. Renters, prepayment customers and homes without mains gas are particularly exposed. The latest overall estimate is a projection.

England only (fuel poverty is measured differently in Scotland, Wales and Northern Ireland) · 2025 (projection from 2024 final estimates) · Accredited official statistics; 2025 figures are projections

Show the workings — Prepayment customers, homes off the gas grid and private renters are about twice as likely as average to be fuel poor

Projected share of households in each group in fuel poverty (low income and a home rated band D or worse), England, 2025. Three separate breakdowns of the same households: by how they pay for electricity, gas connection, and tenure.

Fuel poverty depends on three things together: income, how efficient the home is, and the price of energy. The groups most exposed are those where low incomes meet less efficient homes — private renters, households off the gas grid (who heat with oil or electricity) and those on prepayment meters, whose median income is the lowest. These are associations within one survey, not separate causes. Overall 9.4% of households, 2.36 million, were projected to be fuel poor in 2025; final estimates are due in 2027.

Geography:
England only (fuel poverty is measured differently in Scotland, Wales and Northern Ireland) — All households
Measure:
% of households in the group
Period:
2025 (projection from 2024 final estimates)
Status:
Accredited official statistics; 2025 figures are projections
Calculation:
As published by DESNZ (Low Income Low Energy Efficiency measure). Each breakdown covers all households, so rows from different breakdowns overlap and do not add up.
Compare with:
All households in England, 9.4%
Not included / breaks:
The measure counts a household as fuel poor only if its home is rated band D or below, so a low-income household in an efficient home is not counted however high its bills. DESNZ notes the higher rate among prepayment users reflects their lower incomes, not the tariff itself.

Source: DESNZ, Annual Fuel Poverty Statistics in England, 2026 (2025 data), report pp. 1, 36, 37 and 49 (Figures 3.13, 3.14, 3.26) (released 26 March 2026; corrected 7 August 2026).

View the data as a table
GroupFuel poverty rate, %
Pays electricity by prepayment meter17.9
Off the gas grid17.7
Private renters17.2
Pays electricity by standard credit (on receipt of bill)12.7
Social renters12.0
Pays electricity by direct debit8.1
On the gas grid8.0
Owner occupiers who own outright6.6
Owner occupiers with a mortgage6.5
All households in England9.4
How the fuel-poverty projections were produced

DESNZ projects 2025 from the final 2024 estimates. The underlying English Housing Survey combines interviews and physical inspections of 14,501 occupied dwellings, collected from April 2023 to March 2025. The projection updates this pooled base; it is not a direct survey of 14,501 households in 2025. Final 2025 estimates are due in 2027. These groups overlap, and differences do not establish that a payment method causes fuel poverty.

DESNZ report, methodology and August 2026 correction

What could change

Proposals to consider. The bodies named below would need to agree to deliver them; responsibility is not a recorded commitment. Follow the links for costs and evidence.

  • Connect the power Britain needs

    Improve electricity connections and power supply for industry.

    Who could deliver it: Energy departments, system/network operators and regulators.

    Main trade-off and delivery needs

    Binding specialist/kit constraints; moving charges to households; stranded assets.

    Separate queue management, network reinforcement and industrial levies; identify projects, kit, engineers and regulator decisions.

    Cost: The extra cost is not yet known.

    Costs, drawbacks and evidence →
  • Warm homes, inspected before payment

    Improve insulation, heating and ventilation for households most in need. Survey homes first and check the finished work.

    Who could deliver it: Energy/housing departments, councils and installers.

    Main trade-off and delivery needs

    Damp, overheating, defects and installer constraints; inspection is not a guarantee.

    Target poor-quality homes; survey suitability/ventilation; use qualified installers and independent inspection; establish redress.

    Cost: Only part of the cost has been estimated.

    Costs, drawbacks and evidence →
  • Change how utilities fund investment and share the risks

    Reduce excessive financing costs in essential services and make shareholders bear the cost of failure.

    Who could deliver it: Sector regulators, Treasury, relevant departments and infrastructure bodies.

    Main trade-off and delivery needs

    Underinvestment, legal disputes and transferred taxpayer risk; no additive headline saving.

    Separate sectors and instruments; assess legal/regulatory powers, financing, compensation, investment and service quality.

    Cost: The extra cost is not yet known.

    Costs, drawbacks and evidence →

See all options and what is still unknown →

Some problems have no assessed solution yet: see coverage and gaps.

Domain SWOT

Recorded

Show the findings
Strengths · 3 findings
  • The Warm Homes Plan allocates £4.4bn of grants for low-income homes over five years, within £15bn of public investment.

    England · 2025–26 to 2029–30

  • Most policy costs have already moved off bills onto taxation: since April 2026 they are about a tenth of a typical bill.

    Great Britain · From April 2026

  • Electricity is far cleaner than it was: low-carbon sources generated 64% of UK electricity in 2025, against 25% in 2000; none came from coal in 2025; and each kilowatt-hour supplied carried 147g of CO2 in 2025, against 476g in 2000.

    United Kingdom · 2000 to 2025

Weaknesses · 5 findings
  • Random audits of previously unaudited ECO4/GBIS installations estimated major or Category 1 non-compliance in 98% of external and 29% of internal wall insulation. The NAO identified oversight failures. Extending ECO4 gives time for repair; it does not establish that homes have been put right.

    Great Britain · 2025 statistical audits; ECO4 extension to December 2026

  • The price cap at typical use is £1,723 a year, against £979 before the 2021 gas surge.

    Great Britain · Oct–Dec 2026 (Apr–Sep 2021 comparison)

    Budget 2026 responds to this

    Temporary help with bills (a £100 payment and a VAT cut on electricity to July 2027) and removal of carbon price support rates; none changes the price cap’s underlying level for long.

    Household Energy PaymentSupport for Energy BillsCarbon Price Support (CPS)Track delivery →

  • 9.4% of households in England — about 2.36 million — were projected to be in fuel poverty in 2025, based on 2024 final estimates; these are not final 2025 survey results.

    Depends on: DESNZ projection from final 2024 EHS estimates, conditional on modelled income, efficiency and energy-price changes; final 2025 estimates are due in 2027.

    England · 2025 · modelled estimate

    Budget 2026 responds to this

    Short-term bill support; the payment is targeted by council tax band, not by fuel poverty.

    Household Energy PaymentSupport for Energy BillsTrack delivery →

  • Wholesale costs are about a third of a typical bill and networks almost another third, so cutting policy costs alone cannot bring bills back down.

    Great Britain · From April 2026

  • Connections reform has cut the queue but not yet the wait: before it, offer dates stretched into the 2040s; by June 2026, 713 of the 1,223 projects needed for 2030 (58%, 37GW) had offers, and Ofgem has twice extended the deadline for the rest, now 31 October 2026.

    Great Britain · April 2025 to October 2026

Opportunities · 1 finding
  • Quality-assured upgrades for the least efficient homes, and electricity prices that reward clean heating, could lower bills and gas exposure together.

    Depends on: Installers and inspections keep pace, and households who cannot switch from gas are protected.

    our synthesis

Threats · 2 findings
  • Moving levies onto gas would raise bills for households that cannot switch — Nesta estimated about 19 million gas households paying about £20 a year more before compensation.

    risk

  • Poor installation or ventilation can leave homes damp, and measured savings vary year to year.

    risk

See the whole-UK SWOT →

Domain action plan

Proposed

Possible steps for government and the bodies responsible. These describe the order of work, not promised dates: starting an action and seeing results take different amounts of time.

  1. Short term · prepare

    Identify the grid, investment and household-efficiency bottlenecks.

  2. Medium term · deliver

    Deliver connections and suitable home improvements with trained workers.

  3. Long term · judge results

    Check whether bills and supply risks fall, including for poorer households.

Delivery steps and owners (5)
  1. Prerequisite: Survey homes; rerun levy modelling on the post-April 2026 baseline · Councils and assessors; DESNZ · proposed
  2. Decision: Award grants to named schemes; decide the levy design and compensation · DESNZ and HM Treasury · proposed
  3. Delivery: Install, inspect and fix defects; phase in pricing with protection · Accredited installers; Ofgem and suppliers · proposed
  4. Result: Lower weather-adjusted energy use and fuel poverty · DESNZ statistics · proposed
  5. Delivery: Issue Gate 2 connection offers (Phase 1 deadline extended to 31 October 2026) · NESO and network companies · 31 October 2026 (Ofgem letter, 2 October 2026)

Sources, method and changes

Shareable visual summary

Visual summary

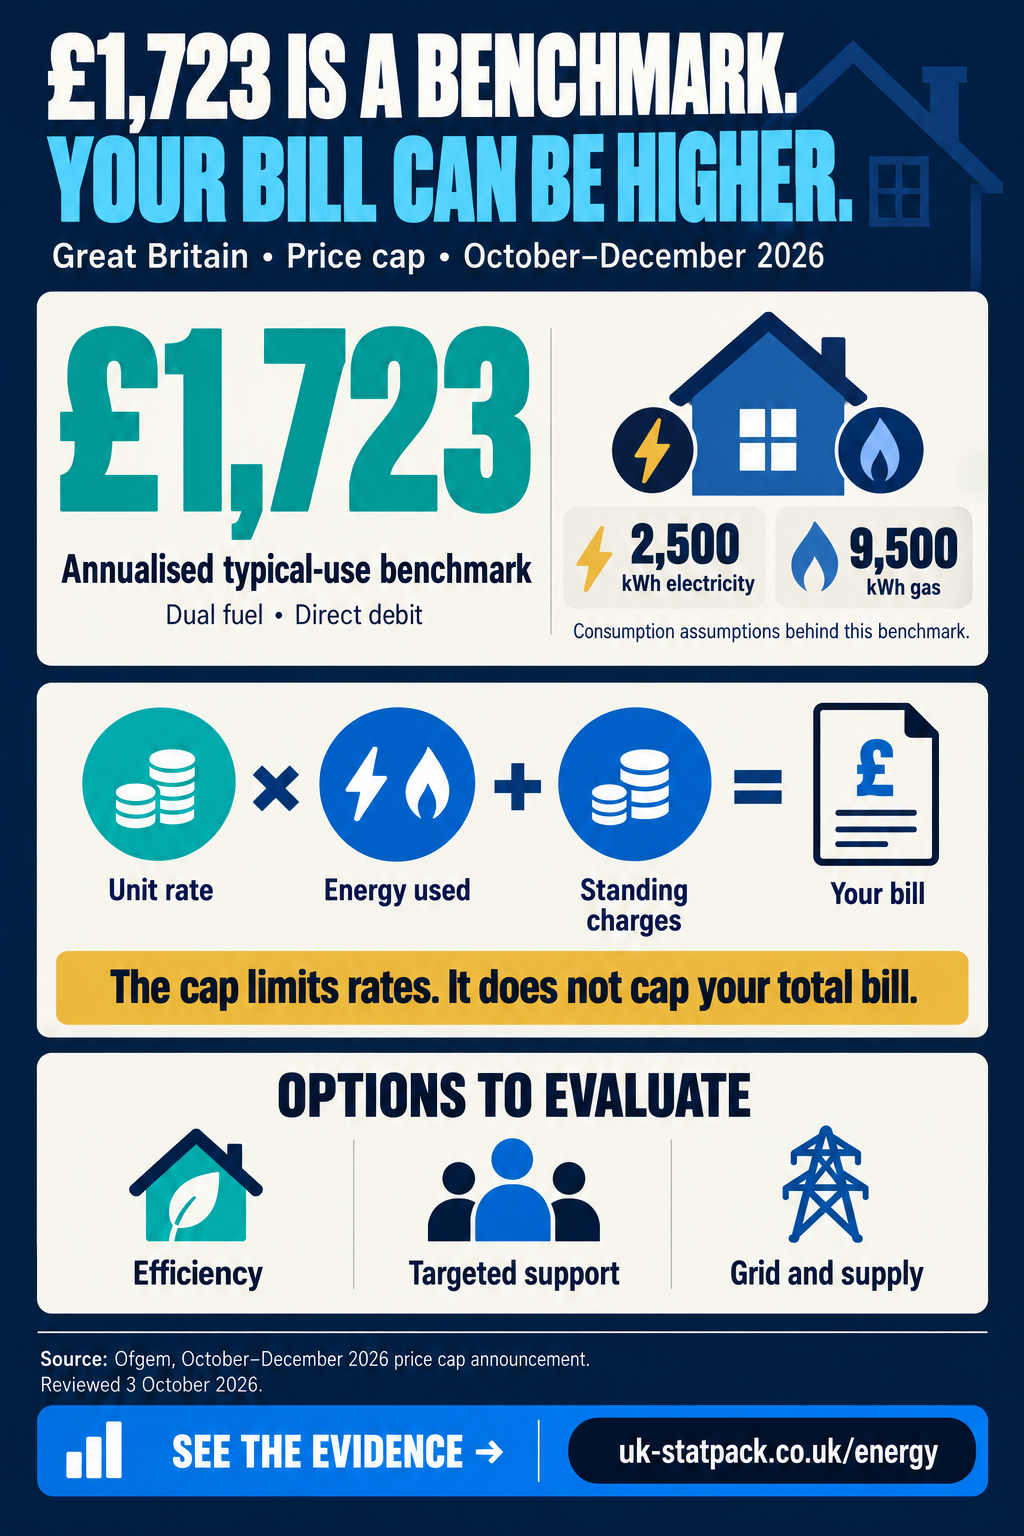
A year of typical energy use costs £1,723, £744 more than in 2021.

At the same typical use (2,500 kWh electricity, 9,500 kWh gas a year), Ofgem’s Great Britain dual-fuel direct-debit cap comes to £1,723 a year for October–December 2026, against £979 in April–September 2021: 76% more in cash, not adjusted for inflation. A benchmark, not a maximum bill: the cap limits unit rates and standing charges; use more and you pay more.

  • £979Apr–September 2021, same typical use
  • £1,723Oct–December 2026, same typical use
  • 76%more in cash terms

Your bill = your usage × capped unit rates + capped daily standing charges.

Great Britain, dual fuel, direct debit. Source: Ofgem, Energy price cap.
Download image (PNG, 1024 by 1536 pixels)

A year of typical energy use costs £1,723, £744 more than in 2021.

Energy infographic: £1,723 is Ofgem’s typical-use annual benchmark for October–December 2026 in Great Britain; it is not a maximum bill.
Text and data version

A year of typical energy use costs £1,723, £744 more than in 2021. At the same typical use (2,500 kWh electricity, 9,500 kWh gas a year), Ofgem’s Great Britain dual-fuel direct-debit cap comes to £1,723 a year for October–December 2026, against £979 in April–September 2021: 76% more in cash, not adjusted for inflation. A benchmark, not a maximum bill: the cap limits unit rates and standing charges; use more and you pay more.

Records behind this visual summary
MeasureValuePeriodGeographyTypeSource
Ofgem price cap, typical dual-fuel direct-debit annual billCalculation: (elec standing charge + elec unit rate × TDCV_electricity) + (gas standing charge + gas unit rate × TDCV_gas), with TDCV set to the value Ofgem used for that cap period£1,723Oct–Dec 2026Great Britainpolicy target (provisional)Ofgem, Default tariff cap
Ofgem price cap at matched typical use, April–September 2021£979Apr–Sep 2021Great Britainpolicy targetOfgem, Default tariff cap
Ofgem price cap at matched typical use, latest period£1,723Oct–Dec 2026Great Britainpolicy target (provisional)Ofgem, Default tariff cap
Cash rise in the typical-use cap since April–September 2021 (same consumption)Calculation: (latest ÷ April–September 2021 − 1) × 100, same typical consumption, cash terms76%Oct–Dec 2026Great Britainderived calculation (provisional)Ofgem, Default tariff cap

Image description: Energy infographic: £1,723 is Ofgem’s typical-use annual benchmark for October–December 2026 in Great Britain; it is not a maximum bill.

Social card

A landscape card for sharing this finding. Post it with the page link — an uploaded image does not link back by itself.

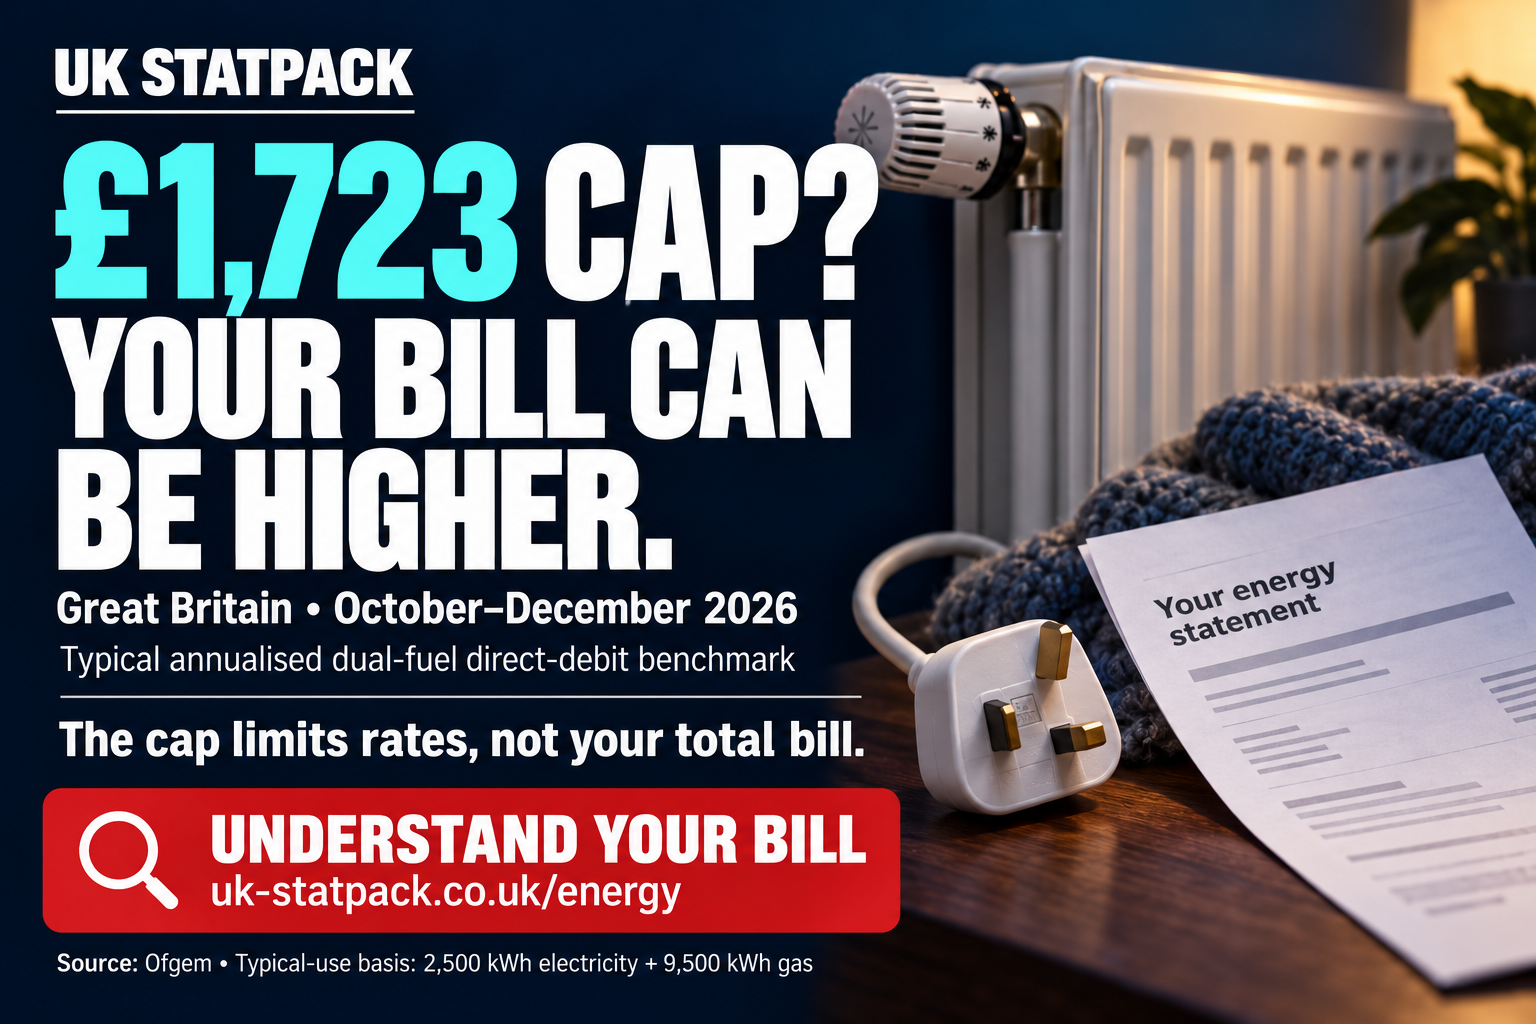
The £1,723 energy-cap figure is a typical-use annualised benchmark for Great Britain, October–December 2026. It limits rates, not your total bill. Understand the assumptions and what your usage changes.
Download image (PNG, 1536 by 1024 pixels)

A year of typical energy use costs £1,723, £744 more than in 2021.

Energy social card. Ofgem’s annualised typical dual-fuel direct-debit cap benchmark was £1,723 in Great Britain for October–December 2026. It is not a maximum bill.

Available images and their source records are listed on Shareable visuals.

Sources and methods (11)

Method notes

  • The cap is set for Great Britain only. Northern Ireland’s energy prices are regulated separately by the Utility Regulator and are not in these figures. CPI indices cover the whole UK; fuel poverty statistics cover England.
  • All cap figures are for default tariffs paid by direct debit, GB average, single-rate electricity. Ofgem restates past periods at its latest typical consumption (2,500 kWh electricity and 9,500 kWh gas from July 2026), so they differ from the figures announced at the time.
  • Real-terms figures deflate each cap period by CPI (all items) for its first month, expressed in Sep 2026 prices. Periods starting after the latest CPI month are left out of the real-terms chart rather than estimated.
  • Unit rates and standing charges are derived from Ofgem’s nil- and typical-consumption levels using Ofgem’s own definition of the cap; they match Ofgem’s published consumer rates to the penny.

Corrections and changes

  • 2026-10-11: Clarified that the cash cap comparison ends in October–December 2026, while the available inflation-adjusted comparison ends in July–September 2026.